Question: The datablock below shows the data for 3,050 speed cameras in the UK. Every row in the datablock is a different camera. For each camera
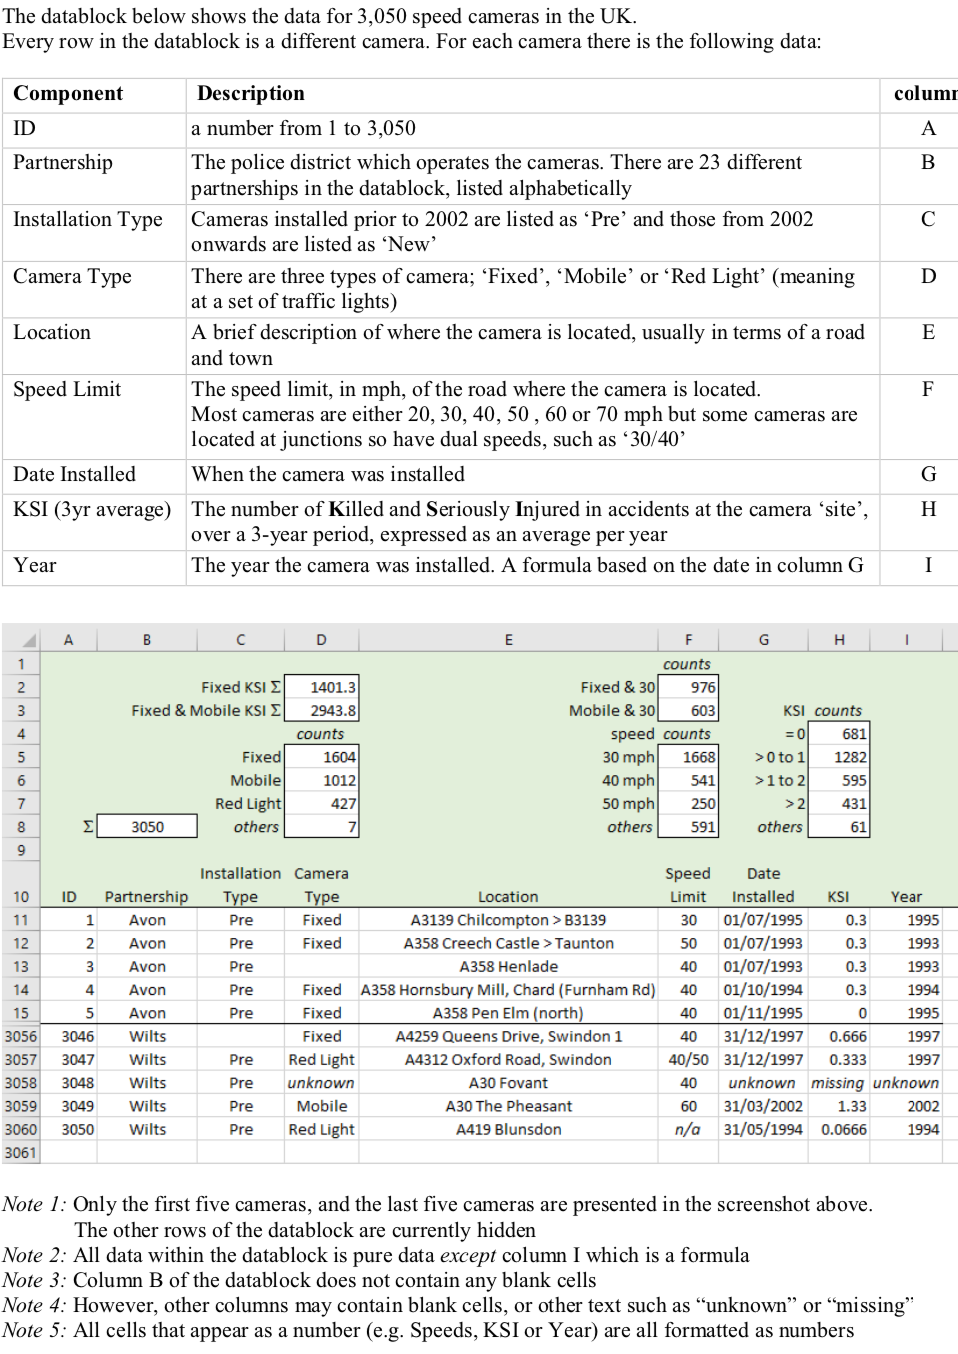
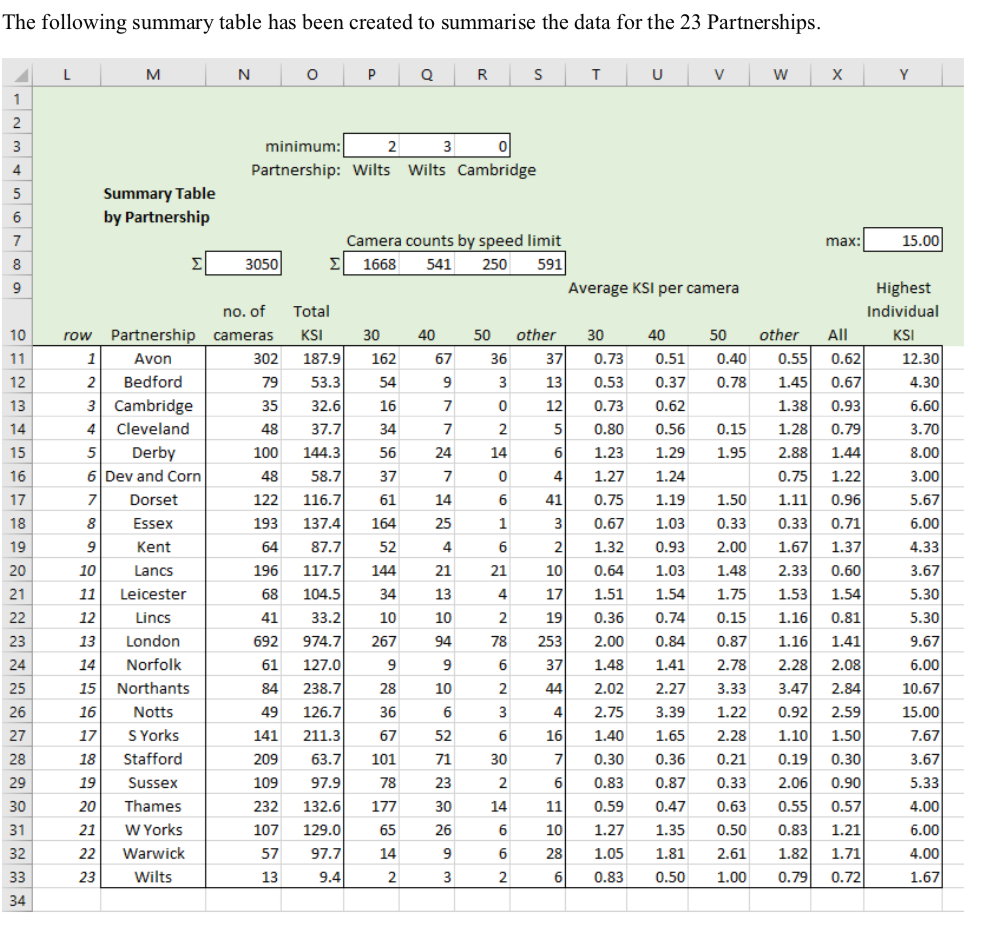
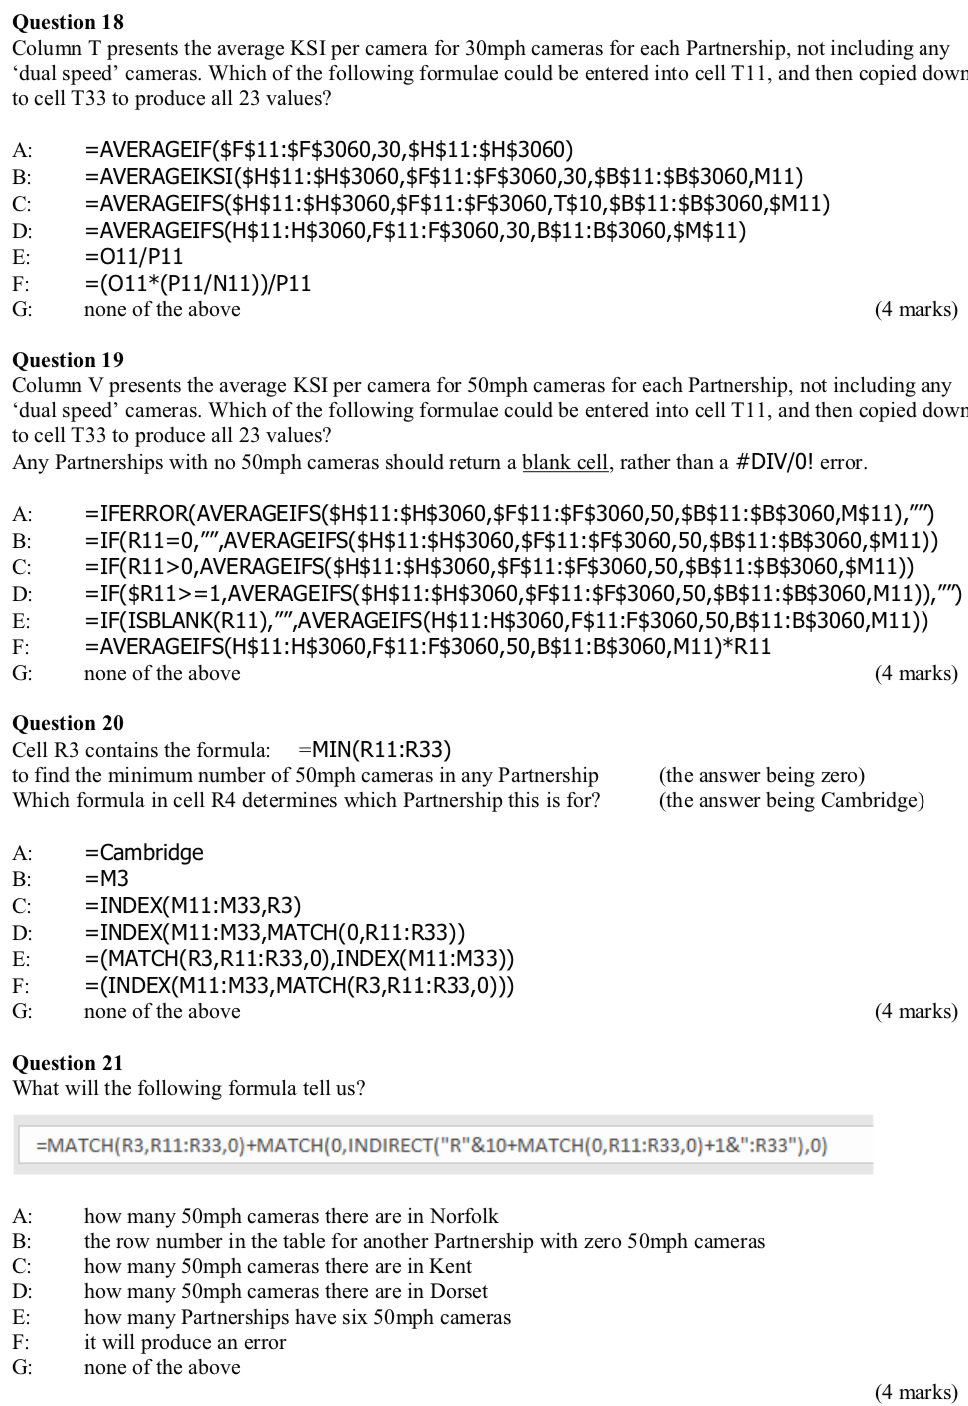
The datablock below shows the data for 3,050 speed cameras in the UK. Every row in the datablock is a different camera. For each camera there is the following data: Component Description colum ID a number from 1 to 3,050 A Partnership B Installation Type C Camera Type D The police district which operates the cameras. There are 23 different partnerships in the datablock, listed alphabetically Cameras installed prior to 2002 are listed as Pre and those from 2002 onwards are listed as 'New' There are three types of camera; Fixed', 'Mobile' or 'Red Light (meaning at a set of traffic lights) A brief description of where the camera is located, usually in terms of a road and town The speed limit, in mph, of the road where the camera is located. Most cameras are either 20, 30, 40, 50, 60 or 70 mph but some cameras are located at junctions so have dual speeds, such as 30/40' Location E Speed Limit F Date Installed When the camera was installed G H KSI (3yr average) The number of Killed and Seriously Injured in accidents at the camera 'site', over a 3-year period, expressed as an average per year Year The year the camera was installed. A formula based on the date in column G I A B D E G H 1 1 counts 2 1401.3 Fixed KSI Fixed & Mobile KSI E 3 2943.8 4 counts 5 Fixed Mobile Red Light others Fixed & 30 976 Mobile & 30 603 speed counts 30 mph 1668 40 mph 541 50 mph 250 others 591 1604 1012 427 6 KSI counts = 0 681 >0 to 1 1282 >1 to 2 595 > 2 431 7 8 3050 others 61 9 Speed Date 10 ID Installation Camera Partnership Type Type 1 Avon Pre Fixed Location Limit Installed KSI Year 11 A3139 Chilcompton > B3139 A358 Creech Castle > Taunton 12 2 Avon Pre Fixed 13 3 Avon Pre A358 Henlade 14 4 Avon Pre 15 5 Avon Pre 30 01/07/1995 0.3 1995 50 01/07/1993 0.3 1993 40 01/07/1993 0.3 1993 40 01/10/1994 0.3 1994 40 01/11/1995 0 1995 40 31/12/1997 0.666 1997 40/50 31/12/1997 0.333 1997 40 unknown missing unknown 60 31/03/2002 1.33 2002 n/a 31/05/1994 0.0666 1994 3056 3046 Fixed A358 Hornsbury Mill, Chard (Furnham Rd) Fixed A358 Pen Elm (north) Fixed A4259 Queens Drive, Swindon 1 Red Light A4312 Oxford Road, Swindon unknown A30 Fovant Wilts 3057 3047 Wilts Pre 3058 3048 Wilts Pre 3059 3049 Wilts Pre Mobile A30 The Pheasant 3060 3050 Wilts Pre Red Light A419 Blunsdon 3061 Note 1: Only the first five cameras, and the last five cameras are presented in the screenshot above. The other rows of the datablock are currently hidden Note 2: All data within the datablock is pure data except column I which is a formula Note 3: Column B of the datablock does not contain any blank cells Note 4: However, other columns may contain blank cells, or other text such as unknown or missing" Note 5: All cells that appear as a number (e.g. Speeds, KSI or Year) are all formatted as numbers The following summary table has been created to summarise the data for the 23 Partnerships. L M N O Q R S T U V w Y 1 2 minimum: 2 Partnership: Wilts 3 0 Wilts Cambridge 4 5 Summary Table by Partnership 6 7 max: 15.00 8 3050 Camera counts by speed limit 1668 541 591 Average KSI per camera 250 9 Highest Individual no. of Total 10 row Partnership cameras KSI 30 40 50 other 30 40 50 other All KSI 11 1 Avon 302 187.9 162 67 36 37 0.73 0.51 0.40 0.55 0.62 12.30 12 2 Bedford 79 53.3 54 9 3 13 0.53 0.37 0.78 1.45 0.67 4.30 13 3 35 16 7 0 12 0.73 0.62 1.38 0.93 6.60 Cambridge Cleveland 32.6 37.7 14 4 48 34 7 2 5 0.80 0.56 0.15 1.28 3.70 15 100 144.3 56 24 14 6 1.23 1.29 1.95 2.88 5 Derby 6 Dev and Corn 16 48 58.7 37 7 0 4 1.27 1.24 0.75 8.00 3.00 5.67 17 7 Dorset 122 116.7 61 14 6 41 0.75 1.19 1.50 1.11 18 8 Essex 193 164 25 1 3 0.67 1.03 0.33 0.33 0.79 1.44 1.22 0.96 0.71) 1.371 0.601 1.54 0.811 6.00 19 9 Kent 137.4 87.7 117.7 64 52 4 6 2 1.32 0.93 2.00 1.67 4.33 20 10 Lancs 196 144 21 21 10 0.64 1.03 1.48 2.33 3.67 21 11 Leicester 68 104.5 34 13 4 17 1.51 1.54 1.75 1.53 5.30 22 12 Lincs 41 33.2 10 10 2 19 0.36 0.74 0.15 1.16 23 13 London 692 974.7 267 94 78 253 2.00 0.84 0.87 1.16 1.41 5.30 9.67 6.00 24 14 Norfolk 61 9 9 6 37 1.48 1.41 2.78 2.28 127.0 238.7 2.08 2.84 25 15 Northants 84 28 10 2 44 2.02 2.27 3.33 3.47 10.67 26 16 Notts 49 126.7 36 6 3 4 2.75 3.39 1.22 0.92 2.59 15.00 27 17 S Yorks 141 211.3 67 52 6 16 1.40 1.65 2.28 1.10 7.67 1.50 0.30 28 18 Stafford 209 63.7 101 71 30 7 0.30 0.36 0.21 0.19 3.67 5.33 29 19 Sussex 109 97.9 78 23 2 6 0.83 0.87 0.33 2.06 30 20 Thames 232 132.6 177 30 14 11 0.59 0.47 0.63 0.55 0.90 0.57 1.21 4.00 6.00 31 21 w Yorks 107 65 26 6 10 1.27 1.35 0.50 0.83 129.0 97.7 32 22 Warwick 57 14 9 6 28 1.05 1.81 2.61 1.82 1.71 4.00 33 23 Wilts 13 9.41 2 3 2 6 0.83 0.50 1.00 0.79 0.72 1.67 34 Question 18 Column T presents the average KSI per camera for 30mph cameras for each Partnership, not including any dual speed cameras. Which of the following formulae could be entered into cell T11, and then copied down to cell T33 to produce all 23 values? A: B: C: D: =AVERAGEIF($F$11:$F$3060,30,$H$11:$H$3060) =AVERAGEIKSI($H$11:$H$3060,$F$11:$F$3060,30,$B$11:$B$3060,M11) =AVERAGEIFS($H$11:$H$3060,$F$11:$F$3060,T$10,$B$11:$B$3060,$M11) =AVERAGEIFS(H$11:H$3060,F$11:F$3060,30,B$11:B$3060,$M$11) =011/P11 =(011*(P11/N11))/P11 none of the above E: F: G: (4 marks) Question 19 Column V presents the average KSI per camera for 50mph cameras for each Partnership, not including any 'dual speed cameras. Which of the following formulae could be entered into cell Til, and then copied down to cell T33 to produce all 23 values? Any Partnerships with no 50mph cameras should return a blank cell, rather than a #DIV/0! error. A: B: C: D: =IFERROR(AVERAGEIFS($H$11:$H$3060,$F$11:$F$3060,50,$B$11:$B$3060,M$11),"') =IF(R11=0,"", AVERAGEIFS($H$11:$H$3060,$F$11:$F$3060,50,$B$11:$B$3060,$M11)) =IF(R11>0, AVERAGEIFS($H$11:$H$3060,$F$11:$F$3060,50,$B$11:$B$3060,$M11)) =IF($R11>=1, AVERAGEIFS($H$11:$H$3060,$F$11:$F$3060,50,$B$11:$B$3060, M11)), '') =IF(ISBLANK(R11),"", AVERAGEIFS(H$11:H$3060,F$11:F$3060,50,B$11:B$3060,M11)) =AVERAGEIFS(H$11:H$3060,F$11:F$3060,50,B$11:B$3060, M11)*R11 none of the above (4 marks) E: F: G: Question 20 Cell R3 contains the formula: =MIN(R11:R33) to find the minimum number of 50mph cameras in any Partnership Which formula in cell R4 determines which Partnership this is for? (the answer being zero) (the answer being Cambridge) A: B: C: D: =Cambridge =M3 =INDEX(M11:M33,R3) =INDEX(M11:M33,MATCH(0,R11:R33) =(MATCH(R3, R11:R33,0),INDEX(M11:M33)) =(INDEX(M11:M33,MATCH(R3,R11:R33,0))) none of the above E: F: G: (4 marks) Question 21 What will the following formula tell us? =MATCH(R3, R11:33,0) +MATCH(O,INDIRECT("R"&10+MATCH(0, R11:33,0)+1&":R33"),0) A: B: C: D: how many 50mph cameras there are in Norfolk the row number in the table for another Partnership with zero 50mph cameras how many 50mph cameras there are in Kent how many 50mph cameras there are in Dorset how many Partnerships have six 50mph cameras it will produce an error none of the above E: F: G: (4 marks)


