

Question: The datafile provided below contains data on the monthly revenue for a large regional distributor of beverages. ( Hint: You can use a PivotChart to
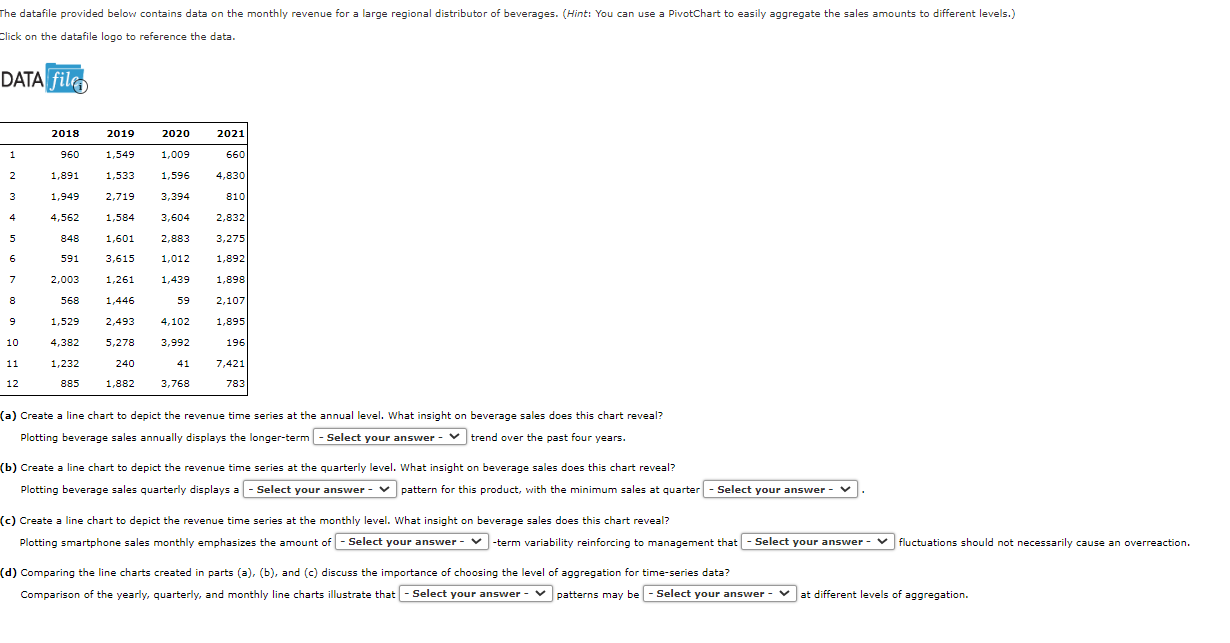
The datafile provided below contains data on the monthly revenue for a large regional distributor of beverages. Hint: You can use a PivotChart to easily aggregate the sales amounts to different levels.
Click on the datafile logo to reference the data.
DATA fili
a Create a line chart to depict the revenue time series at the annual level. What insight on beverage sales does this chart reveal?
Plotting beverage sales annually displays the longertern
trend over the past four years.
b Create a line chart to depict the revenue time series at the quarterly level. What insight on beverage sales does this chart reveal?
Plotting beverage sales quarterly displays a
Select your answer
pattern for this product, with the minimum sales at quarter
c Create a line chart to depict the revenue time series at the monthly level. What insight on beverage sales does this chart reveal?
Plotting smartphone sales monthly emphasizes the amount of
Select your answer
term variability reinforcing to management that
Select your answer
fluctuations should not necessarily cause an overreaction.
d Comparing the line charts created in parts ab and c discuss the importance of choosing the level of aggregation for timeseries data?
Comparison of the yearly, quarterly, and monthly line charts illustrate that
Step by Step Solution
There are 3 Steps involved in it
1 Expert Approved Answer
Step: 1 Unlock

Question Has Been Solved by an Expert!
Get step-by-step solutions from verified subject matter experts
Step: 2 Unlock
Step: 3 Unlock