

Question: The dataset below represents a sample of text messages sent during math class in a week by middle school students. table [ [ 1
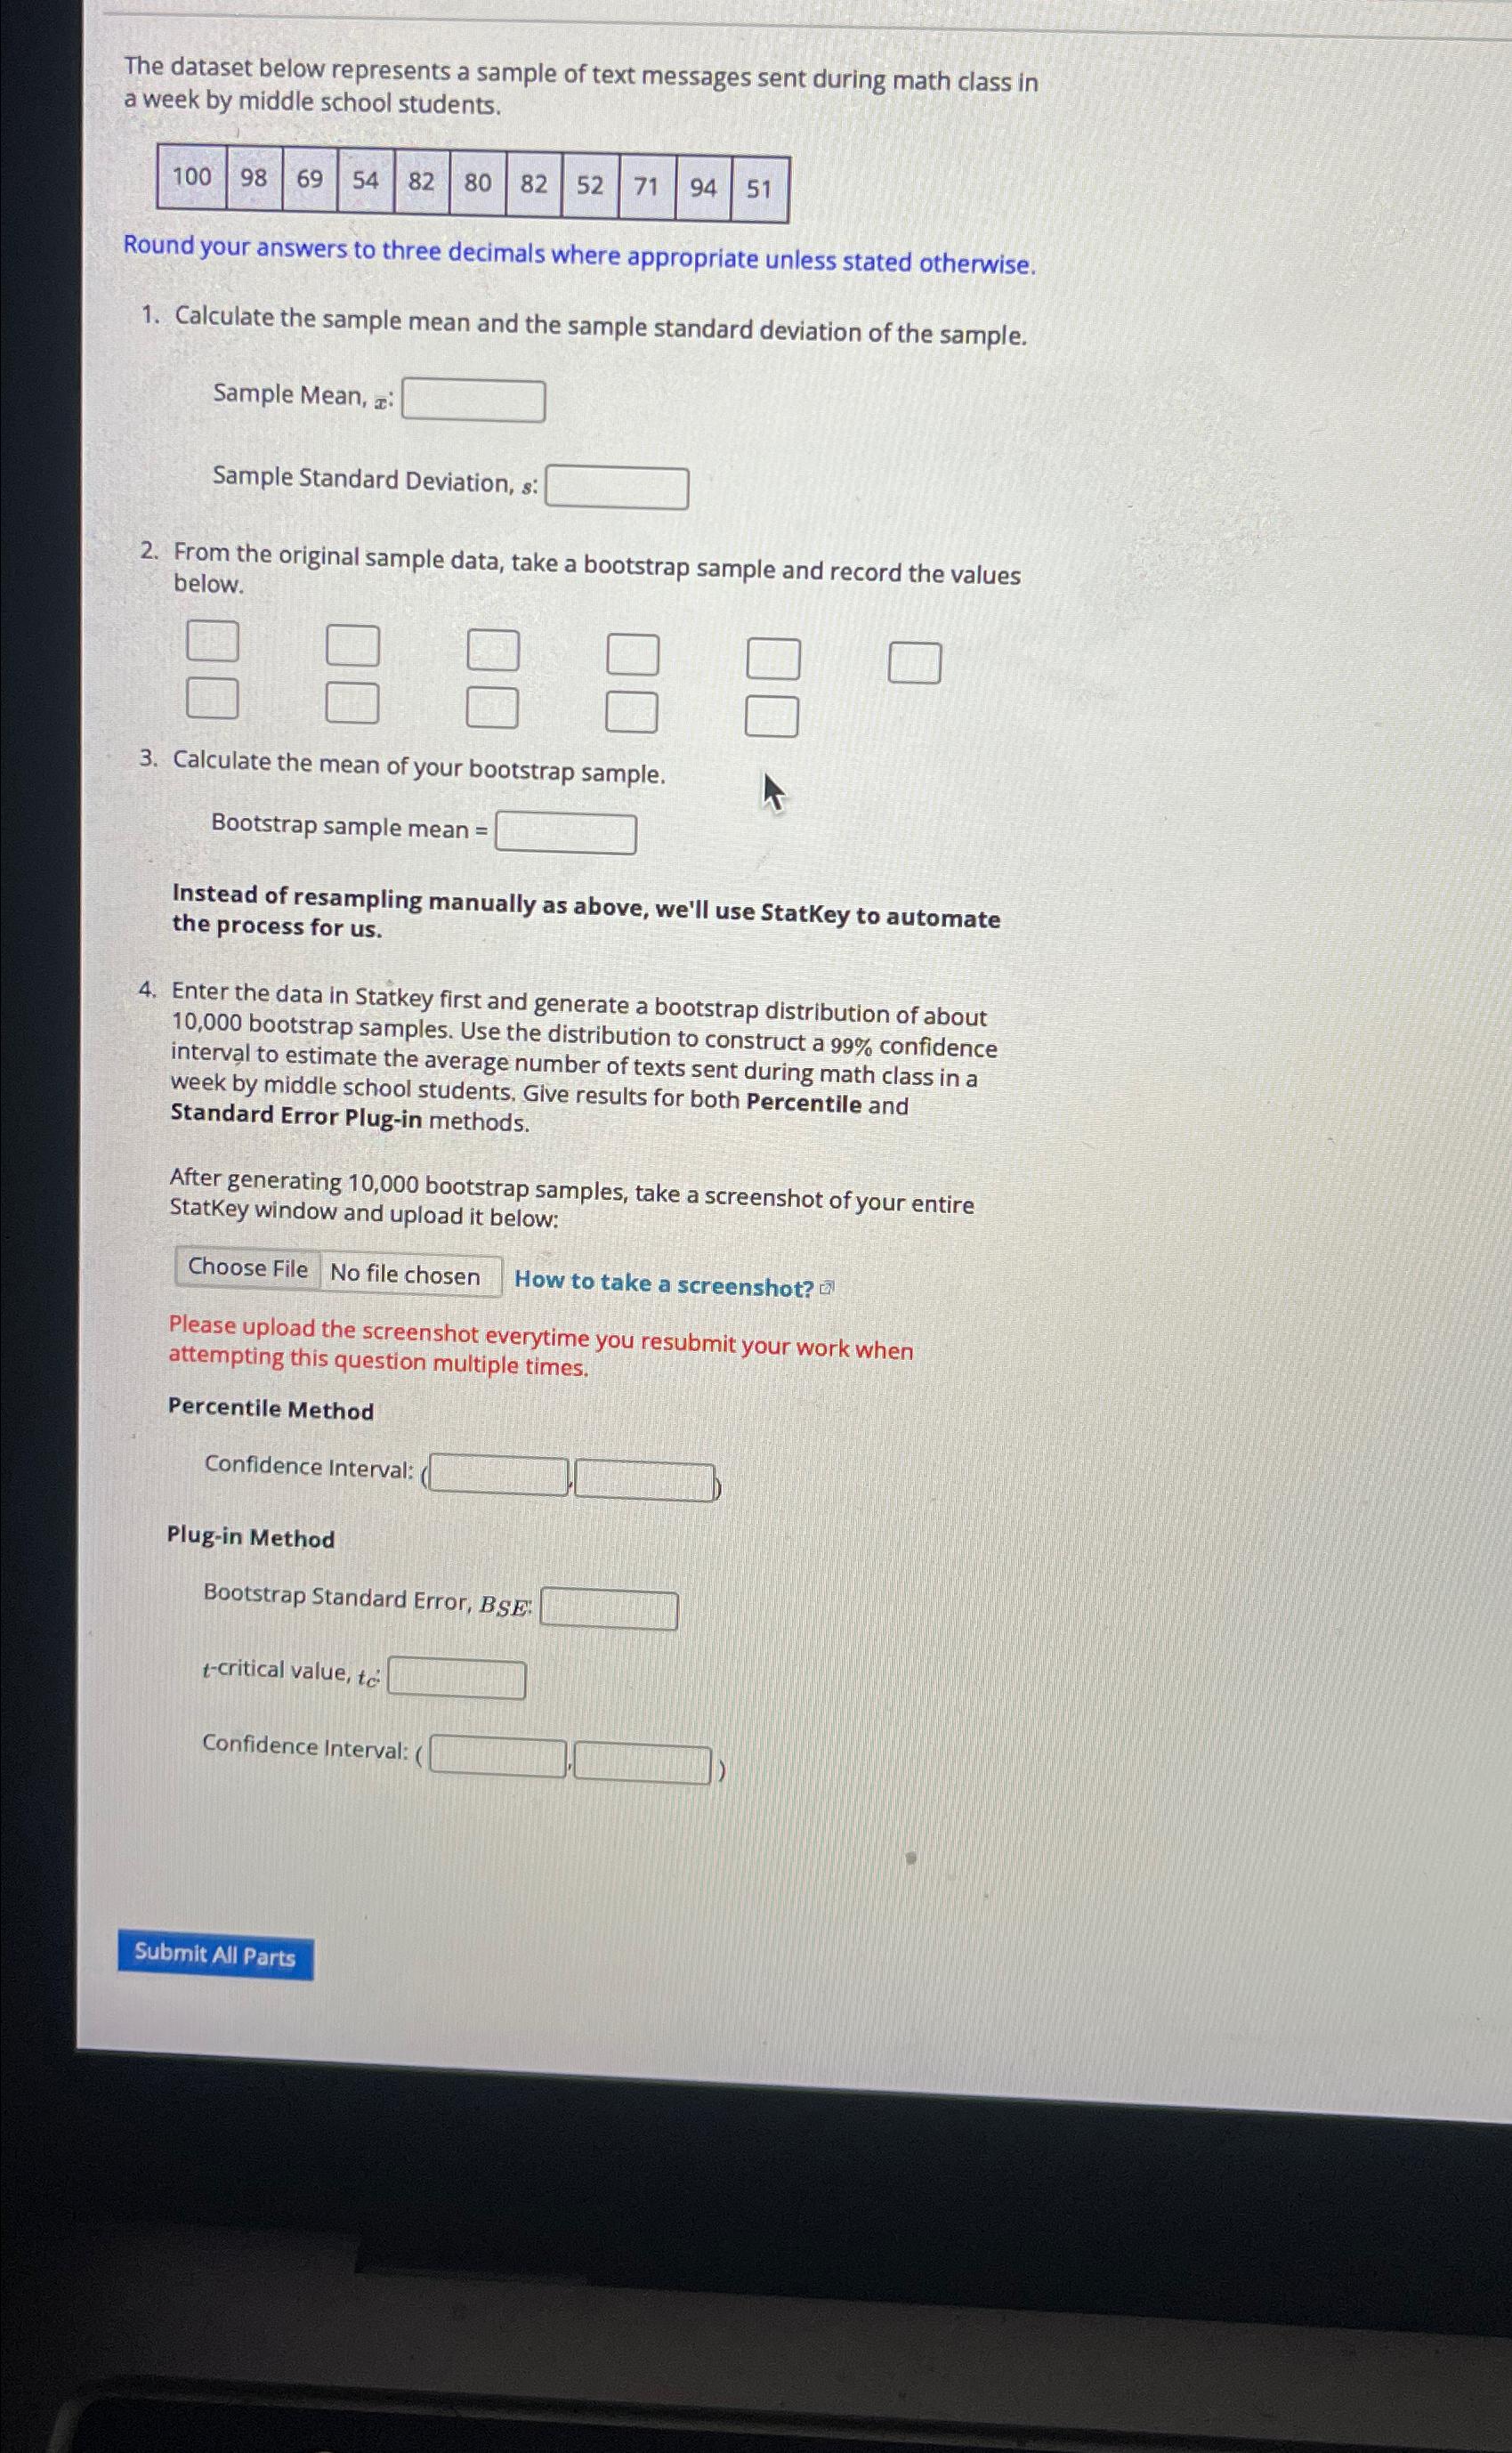
The dataset below represents a sample of text messages sent during math class in a week by middle school students.
table
Round your answers to three decimals where appropriate unless stated otherwise.
Calculate the sample mean and the sample standard deviation of the sample.
Sample Mean, :
Sample Standard Deviation, :
From the original sample data, take a bootstrap sample and record the values below.
Calculate the mean of your bootstrap sample.
Bootstrap sample mean
Instead of resampling manually as above, we'll use StatKey to automate the process for us
Enter the data in Statkey first and generate a bootstrap distribution of about bootstrap samples. Use the distribution to construct a confidence interval to estimate the average number of texts sent during math class in a week by middle school students, Give results for both Percentile and Standard Error Plugin methods.
After generating bootstrap samples, take a screenshot of your entire Statkey window and upload it below:
Choose File No file chosen How to take a screenshot?
Please upload the screenshot everytime you resubmit your work when attempting this question multiple times.
Percentile Method
Confidence Interval:
Plugin Method
Bootstrap Standard Error, BSE:
critical value,
Confidence Interval:
Step by Step Solution
There are 3 Steps involved in it
1 Expert Approved Answer
Step: 1 Unlock

Question Has Been Solved by an Expert!
Get step-by-step solutions from verified subject matter experts
Step: 2 Unlock
Step: 3 Unlock