

Question: The date for the table is November 2007. pi Problems 1 - 4 are based on the prices in the table on the next page
The date for the table is November 2007.
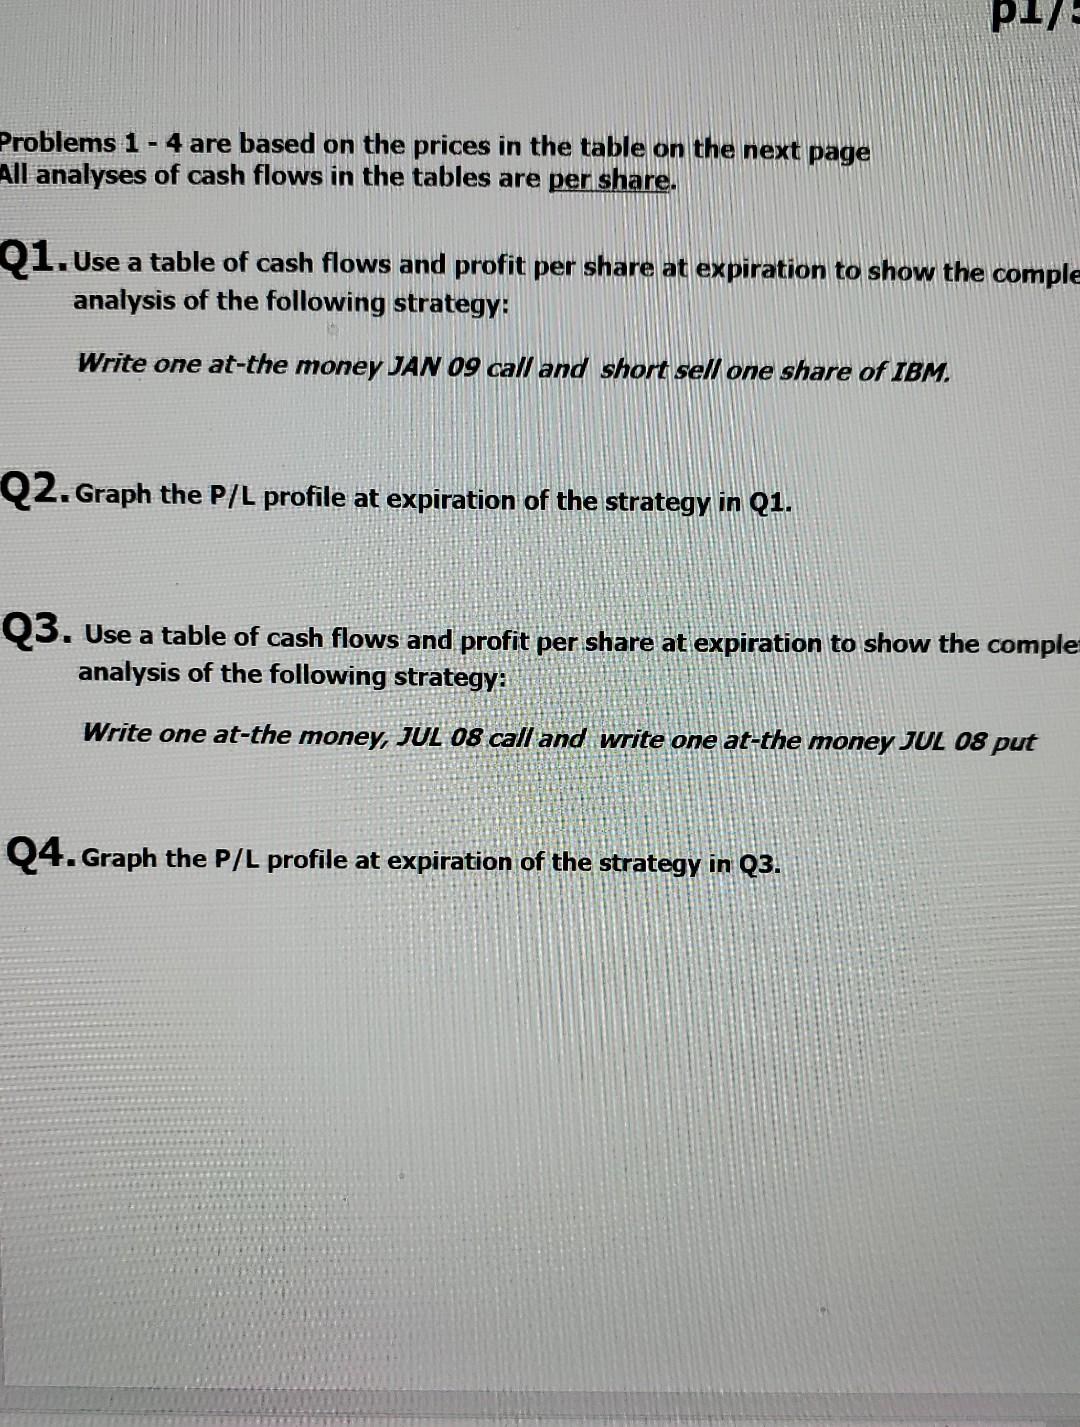
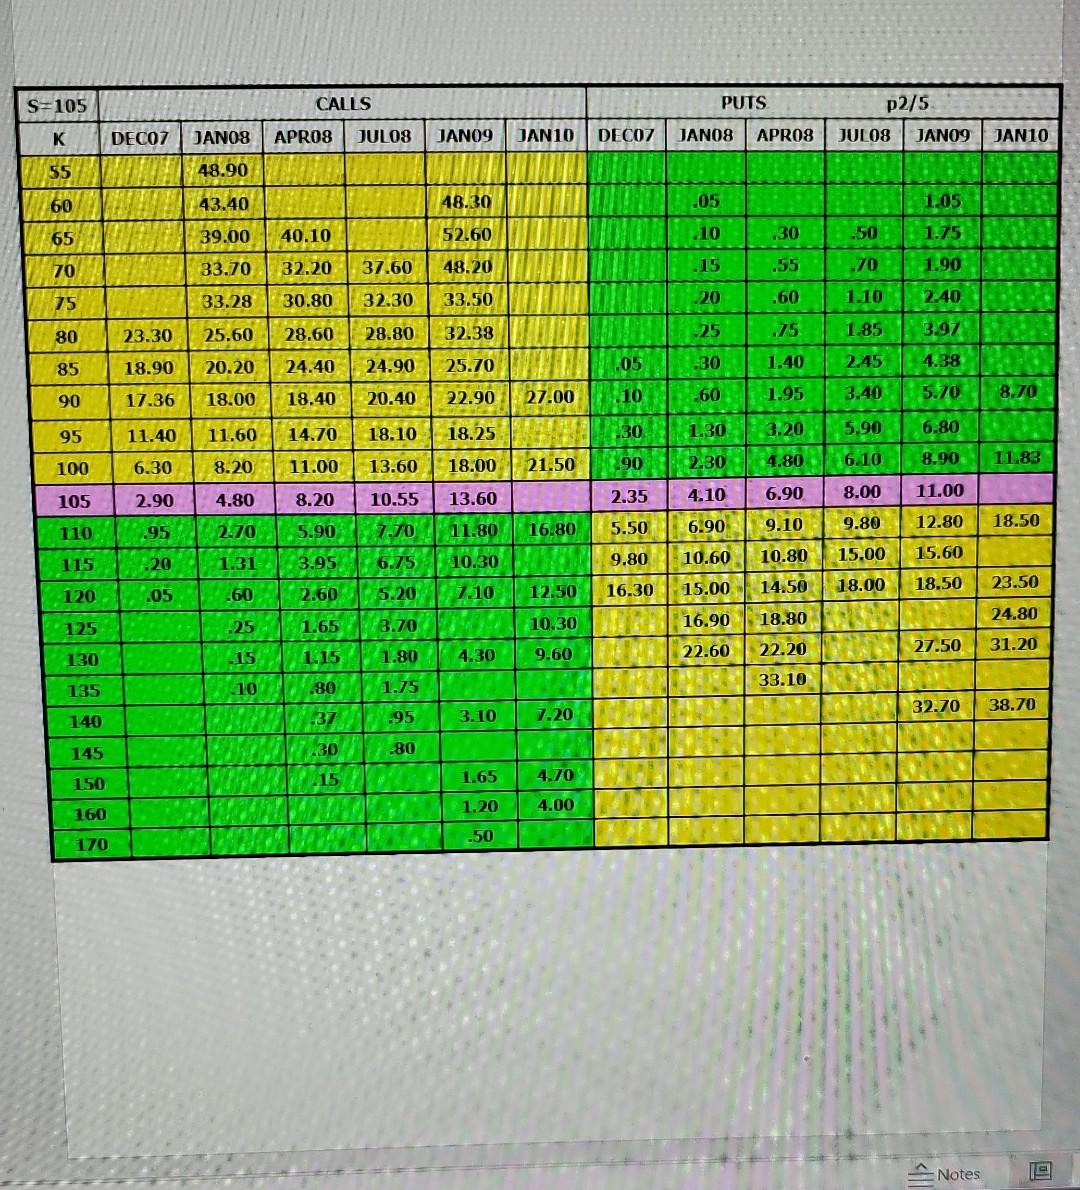
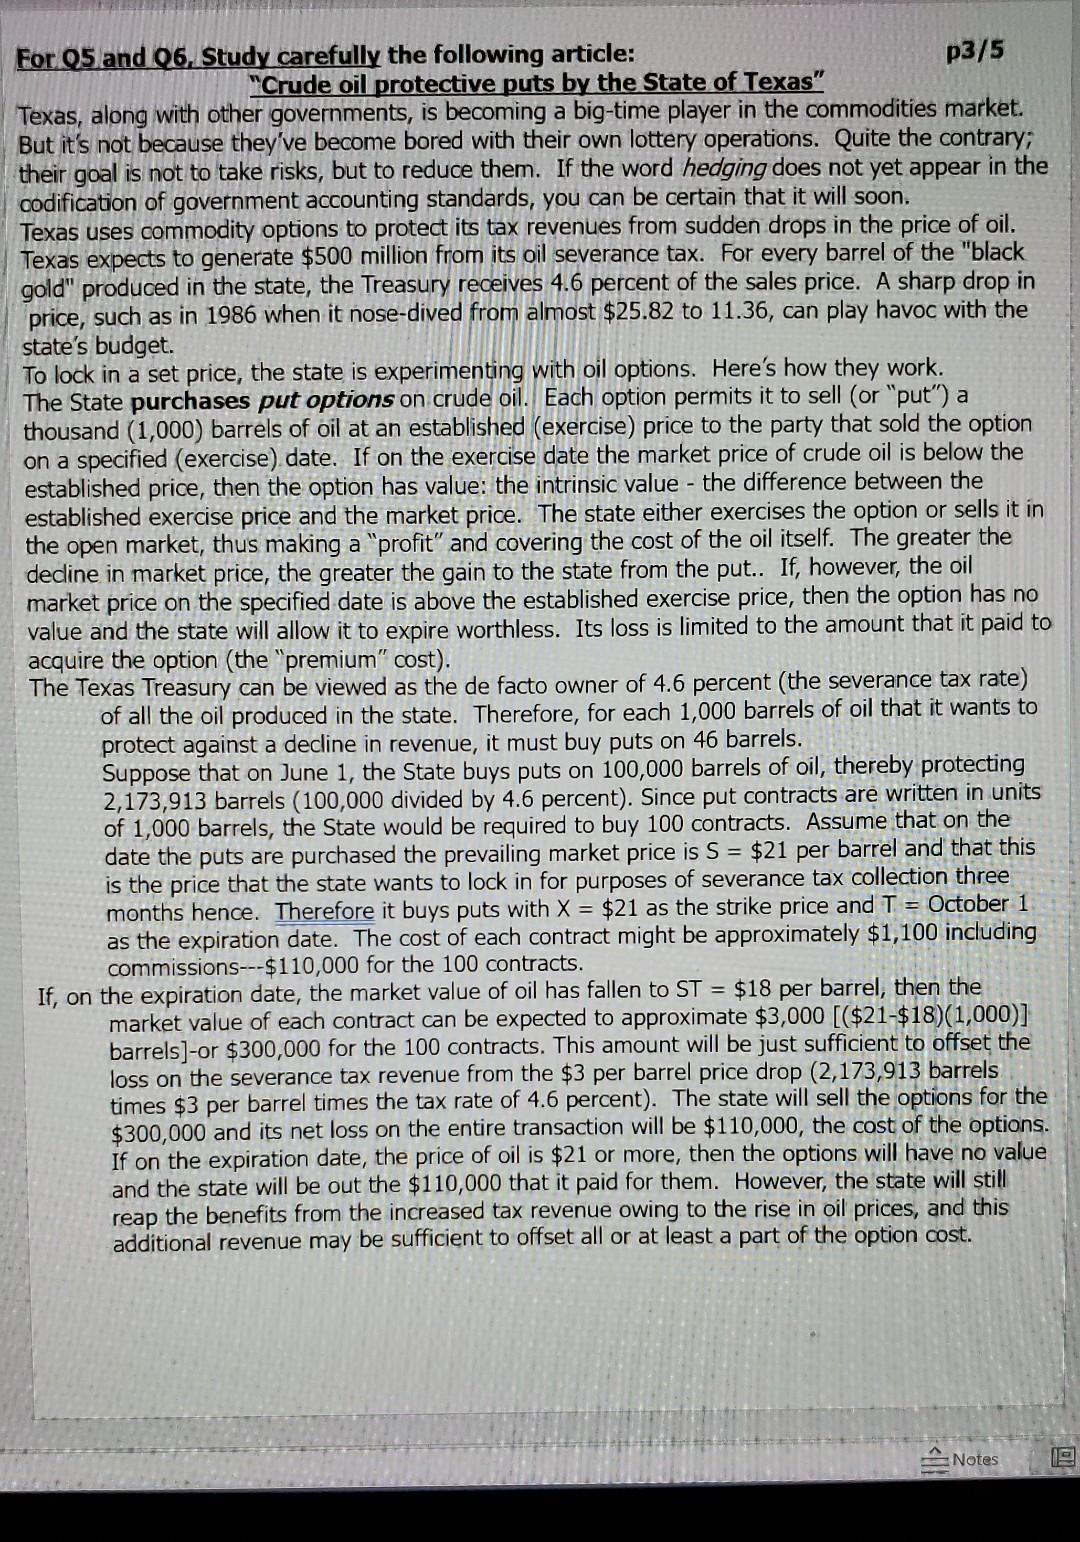
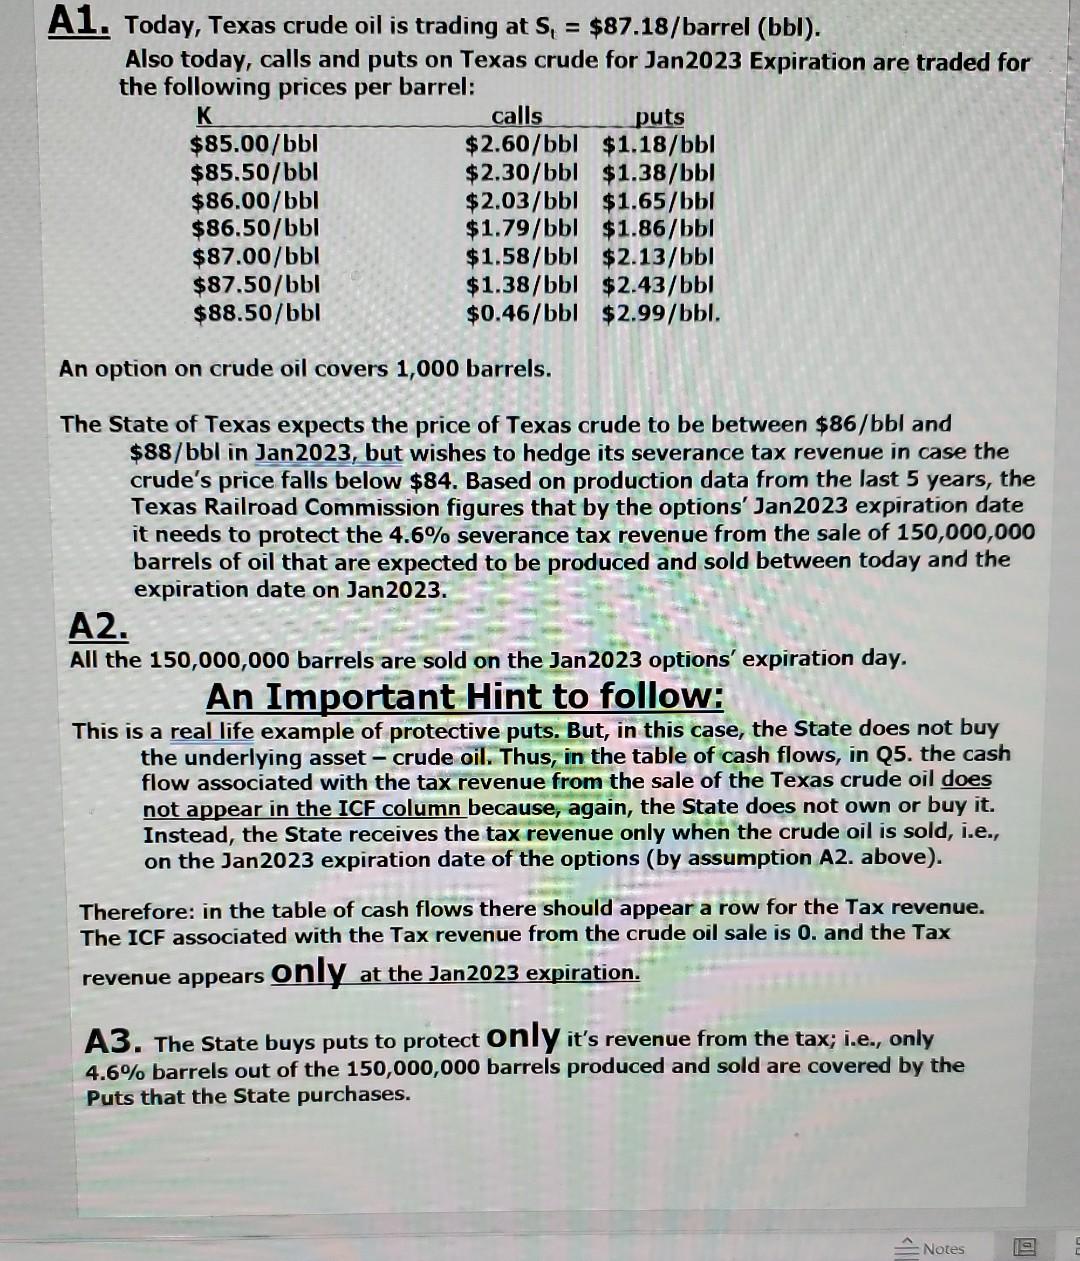
pi Problems 1 - 4 are based on the prices in the table on the next page All analyses of cash flows in the tables are per share. Q1. Use a table of cash flows and profit per share at expiration to show the comple analysis of the following strategy: Write one at-the money JAN 09 call and short sell one share of IBM. Q2. Graph the P/L profile at expiration of the strategy in Q1. Q3. Use a table of cash flows and profit per share at expiration to show the comple analysis of the following strategy: Write one at-the money, JUL 08 call and write one at-the money JUL 08 put Q4. Graph the P/L profile at expiration of the strategy in Q3. S=105 CALLS PUTS p2/5 JULOS JANO9 K DECO7 JANOS APRO8 JULOS JANO9 JAN10 DECO7 JANOS APROS JAN10 55 48.90 60 48.30 .05 43.40 39.00 65 40.10 52.60 .10 .30 .50 70 33.70 32.20 37.60 48.20 .15 .55 .70 1.05 1.75 1.90 2.40 3.97 33.28 75 30.80 32.30 33.50 20 1.10 .60 23.30 25.60 28.60 80 28.80 32.38 25 .75 1.85 85 18.90 20.20 24.40 24.90 25.70 .05 :30 1.40 2.45 4.38 90 17.36 18.00 18.40 20.40 22.90 27.00 -10 .60 8.70 1.95 3.40 5.70 95 11.40 11.60 14.70 18.10 18.25 30 1.30 3.20 5.90 6.80 8.20 11.00 100 6.30 13.60 18.00 21.50 90 2.30 4.80 6.10 8.90 11.83 105 2.90 8.20 11.00 10.55 13.60 2.35 4.10 6.90 8.00 4.80 2.70 110 12.80 11.80 5.50 6.90 18.50 16.80 9.10 95 9.80 5.90 3.95 7.70 6.75 115 :20 1.31 15.60 9.80 10.80 15.00 10.30 7.10 10.60 15.00 120 18.50 18.00 .05 60 12.50 23.50 14.50 2.60 5.20 16.30 125 24.80 -25 1.65 3.70 18.80 10.30 16.90 130 15 27.50 31.20 1.15 1.80 4.30 9.60 22.60 22.20 135 10 .80 33.10 1.75 32.70 38.70 140 .95 3.10 7.20 37 .30 145 .80 SU 150 15 1.65 4.70 4.00 160 1.20 .50 170 A Notes For 25 and 26. Study carefully the following article: p3/5 "Crude oil protective puts by the State of Texas" Texas, along with other governments, is becoming a big-time player in the commodities market. But it's not because they've become bored with their own lottery operations. Quite the contrary; their goal is not to take risks, but to reduce them. If the word hedging does not yet appear in the codification of government accounting standards, you can be certain that it will soon. Texas uses commodity options to protect its tax revenues from sudden drops in the price of oil. Texas expects to generate $500 million from its oil severance tax. For every barrel of the "black gold" produced in the state, the Treasury receives 4.6 percent of the sales price. A sharp drop in price, such as in 1986 when it nose-dived from almost $25.82 to 11.36, can play havoc with the state's budget. To lock in a set price, the state is experimenting with oil options. Here's how they work. The State purchases put options on crude oil. Each option permits it to sell (or "put") a thousand (1,000) barrels of oil at an established (exercise) price to the party that sold the option on a specified (exercise) date. If on the exercise date the market price of crude oil is below the established price, then the option has value: the intrinsic value - the difference between the established exercise price and the market price. The state either exercises the option or sells it in the open market, thus making a "profit" and covering the cost of the oil itself. The greater the decline in market price, the greater the gain to the state from the put.. If, however, the oil market price on the specified date is above the established exercise price, then the option has no value and the state will allow it to expire worthless. Its loss is limited to the amount that it paid to acquire the option (the "premium" cost). The Texas Treasury can be viewed as the de facto owner of 4.6 percent (the severance tax rate) of all the oil produced in the state. Therefore, for each 1,000 barrels of oil that it wants to protect against a decline in revenue, it must buy puts on 46 barrels. Suppose that on June 1, the State buys puts on 100,000 barrels of oil, thereby protecting 2,173,913 barrels (100,000 divided by 4.6 percent). Since put contracts are written in units of 1,000 barrels, the State would be required to buy 100 contracts. Assume that on the date the puts are purchased the prevailing market price is S = $21 per barrel and that this is the price that the state wants to lock in for purposes of severance tax collection three months hence. Therefore it buys puts with X = $21 as the strike price and T = October 1 as the expiration date. The cost of each contract might be approximately $1,100 including commissions---$110,000 for the 100 contracts. If, on the expiration date, the market value of oil has fallen to ST = $18 per barrel, then the market value of each contract can be expected to approximate $3,000 [($21-$18)(1,000)] barrels]-or $300,000 for the 100 contracts. This amount will be just sufficient to offset the loss on the severance tax revenue from the $3 per barrel price drop (2,173,913 barrels times $3 per barrel times the tax rate of 4.6 percent). The state will sell the options for the $300,000 and its net loss on the entire transaction will be $110,000, the cost of the options. If on the expiration date, the price of oil is $21 or more, then the options will have no value and the state will be out the $110,000 that it paid for them. However, the state will still reap the benefits from the increased tax revenue owing to the rise in oil prices, and this additional revenue may be sufficient to offset all or at least a part of the option cost. Notes 19 A1. Today, Texas crude oil is trading at S, = $87.18/barrel (bbl). Also today, calls and puts on Texas crude for Jan 2023 Expiration are traded for the following prices per barrel: K calls puts $85.00/bbl $2.60/bbl $1.18/bbl $85.50/bbl $2.30/bbl $1.38/bbl $86.00/bbl $2.03/bbl $1.65/bbl $86.50/bbl $1.79/bbl $1.86/bbl $87.00/bbl $1.58/bbl $2.13/bbl $87.50/bbl $1.38/bbl $2.43/bbl $88.50/bbl $0.46/bbl $2.99/bbl. An option on crude oil covers 1,000 barrels. The State of Texas expects the price of Texas crude to be between $86/bbl and $88/bblin Jan 2023, but wishes to hedge its severance tax revenue in case the crude's price falls below $84. Based on production data from the last 5 years, the Texas Railroad Commission figures that by the options' Jan 2023 expiration date it needs to protect the 4.6% severance tax revenue from the sale of 150,000,000 barrels of oil that are expected to be produced and sold between today and the expiration date on Jan 2023. A2. All the 150,000,000 barrels are sold on the Jan 2023 options' expiration day. An Important Hint to follow: This is a real life example of protective puts. But, in this case, the State does not buy the underlying asset - crude oil. Thus, in the table of cash flows, in Q5. the cash flow associated with the tax revenue from the sale of the Texas crude oil does not appear in the ICF column because, again, the State does not own or buy it. Instead, the State receives the tax revenue only when the crude oil is sold, i.e., on the Jan2023 expiration date of the options (by assumption A2. above). Therefore: in the table of cash flows there should appear a row for the Tax revenue. The ICF associated with the Tax revenue from the crude oil sale is 0. and the Tax revenue appears only at the Jan2023 expiration. A3. The State buys puts to protect only it's revenue from the tax; i.e., only 4.6% barrels out of the 150,000,000 barrels produced and sold are covered by the Puts that the State purchases. Notes la p 5/5 Q5. Consider the following strategy: The State buys the K = $85.50, Jan2023 puts. Use a table of CF/barrel to describe the ICF/barrel, the cash flow at expiration and the P/L per barrel on Jan 2023 expiration from this strategy. Q6. Graph the P/L profile per barrel of the State's strategy from Q5., at Jan 2023 expiration. pi Problems 1 - 4 are based on the prices in the table on the next page All analyses of cash flows in the tables are per share. Q1. Use a table of cash flows and profit per share at expiration to show the comple analysis of the following strategy: Write one at-the money JAN 09 call and short sell one share of IBM. Q2. Graph the P/L profile at expiration of the strategy in Q1. Q3. Use a table of cash flows and profit per share at expiration to show the comple analysis of the following strategy: Write one at-the money, JUL 08 call and write one at-the money JUL 08 put Q4. Graph the P/L profile at expiration of the strategy in Q3. S=105 CALLS PUTS p2/5 JULOS JANO9 K DECO7 JANOS APRO8 JULOS JANO9 JAN10 DECO7 JANOS APROS JAN10 55 48.90 60 48.30 .05 43.40 39.00 65 40.10 52.60 .10 .30 .50 70 33.70 32.20 37.60 48.20 .15 .55 .70 1.05 1.75 1.90 2.40 3.97 33.28 75 30.80 32.30 33.50 20 1.10 .60 23.30 25.60 28.60 80 28.80 32.38 25 .75 1.85 85 18.90 20.20 24.40 24.90 25.70 .05 :30 1.40 2.45 4.38 90 17.36 18.00 18.40 20.40 22.90 27.00 -10 .60 8.70 1.95 3.40 5.70 95 11.40 11.60 14.70 18.10 18.25 30 1.30 3.20 5.90 6.80 8.20 11.00 100 6.30 13.60 18.00 21.50 90 2.30 4.80 6.10 8.90 11.83 105 2.90 8.20 11.00 10.55 13.60 2.35 4.10 6.90 8.00 4.80 2.70 110 12.80 11.80 5.50 6.90 18.50 16.80 9.10 95 9.80 5.90 3.95 7.70 6.75 115 :20 1.31 15.60 9.80 10.80 15.00 10.30 7.10 10.60 15.00 120 18.50 18.00 .05 60 12.50 23.50 14.50 2.60 5.20 16.30 125 24.80 -25 1.65 3.70 18.80 10.30 16.90 130 15 27.50 31.20 1.15 1.80 4.30 9.60 22.60 22.20 135 10 .80 33.10 1.75 32.70 38.70 140 .95 3.10 7.20 37 .30 145 .80 SU 150 15 1.65 4.70 4.00 160 1.20 .50 170 A Notes For 25 and 26. Study carefully the following article: p3/5 "Crude oil protective puts by the State of Texas" Texas, along with other governments, is becoming a big-time player in the commodities market. But it's not because they've become bored with their own lottery operations. Quite the contrary; their goal is not to take risks, but to reduce them. If the word hedging does not yet appear in the codification of government accounting standards, you can be certain that it will soon. Texas uses commodity options to protect its tax revenues from sudden drops in the price of oil. Texas expects to generate $500 million from its oil severance tax. For every barrel of the "black gold" produced in the state, the Treasury receives 4.6 percent of the sales price. A sharp drop in price, such as in 1986 when it nose-dived from almost $25.82 to 11.36, can play havoc with the state's budget. To lock in a set price, the state is experimenting with oil options. Here's how they work. The State purchases put options on crude oil. Each option permits it to sell (or "put") a thousand (1,000) barrels of oil at an established (exercise) price to the party that sold the option on a specified (exercise) date. If on the exercise date the market price of crude oil is below the established price, then the option has value: the intrinsic value - the difference between the established exercise price and the market price. The state either exercises the option or sells it in the open market, thus making a "profit" and covering the cost of the oil itself. The greater the decline in market price, the greater the gain to the state from the put.. If, however, the oil market price on the specified date is above the established exercise price, then the option has no value and the state will allow it to expire worthless. Its loss is limited to the amount that it paid to acquire the option (the "premium" cost). The Texas Treasury can be viewed as the de facto owner of 4.6 percent (the severance tax rate) of all the oil produced in the state. Therefore, for each 1,000 barrels of oil that it wants to protect against a decline in revenue, it must buy puts on 46 barrels. Suppose that on June 1, the State buys puts on 100,000 barrels of oil, thereby protecting 2,173,913 barrels (100,000 divided by 4.6 percent). Since put contracts are written in units of 1,000 barrels, the State would be required to buy 100 contracts. Assume that on the date the puts are purchased the prevailing market price is S = $21 per barrel and that this is the price that the state wants to lock in for purposes of severance tax collection three months hence. Therefore it buys puts with X = $21 as the strike price and T = October 1 as the expiration date. The cost of each contract might be approximately $1,100 including commissions---$110,000 for the 100 contracts. If, on the expiration date, the market value of oil has fallen to ST = $18 per barrel, then the market value of each contract can be expected to approximate $3,000 [($21-$18)(1,000)] barrels]-or $300,000 for the 100 contracts. This amount will be just sufficient to offset the loss on the severance tax revenue from the $3 per barrel price drop (2,173,913 barrels times $3 per barrel times the tax rate of 4.6 percent). The state will sell the options for the $300,000 and its net loss on the entire transaction will be $110,000, the cost of the options. If on the expiration date, the price of oil is $21 or more, then the options will have no value and the state will be out the $110,000 that it paid for them. However, the state will still reap the benefits from the increased tax revenue owing to the rise in oil prices, and this additional revenue may be sufficient to offset all or at least a part of the option cost. Notes 19 A1. Today, Texas crude oil is trading at S, = $87.18/barrel (bbl). Also today, calls and puts on Texas crude for Jan 2023 Expiration are traded for the following prices per barrel: K calls puts $85.00/bbl $2.60/bbl $1.18/bbl $85.50/bbl $2.30/bbl $1.38/bbl $86.00/bbl $2.03/bbl $1.65/bbl $86.50/bbl $1.79/bbl $1.86/bbl $87.00/bbl $1.58/bbl $2.13/bbl $87.50/bbl $1.38/bbl $2.43/bbl $88.50/bbl $0.46/bbl $2.99/bbl. An option on crude oil covers 1,000 barrels. The State of Texas expects the price of Texas crude to be between $86/bbl and $88/bblin Jan 2023, but wishes to hedge its severance tax revenue in case the crude's price falls below $84. Based on production data from the last 5 years, the Texas Railroad Commission figures that by the options' Jan 2023 expiration date it needs to protect the 4.6% severance tax revenue from the sale of 150,000,000 barrels of oil that are expected to be produced and sold between today and the expiration date on Jan 2023. A2. All the 150,000,000 barrels are sold on the Jan 2023 options' expiration day. An Important Hint to follow: This is a real life example of protective puts. But, in this case, the State does not buy the underlying asset - crude oil. Thus, in the table of cash flows, in Q5. the cash flow associated with the tax revenue from the sale of the Texas crude oil does not appear in the ICF column because, again, the State does not own or buy it. Instead, the State receives the tax revenue only when the crude oil is sold, i.e., on the Jan2023 expiration date of the options (by assumption A2. above). Therefore: in the table of cash flows there should appear a row for the Tax revenue. The ICF associated with the Tax revenue from the crude oil sale is 0. and the Tax revenue appears only at the Jan2023 expiration. A3. The State buys puts to protect only it's revenue from the tax; i.e., only 4.6% barrels out of the 150,000,000 barrels produced and sold are covered by the Puts that the State purchases. Notes la p 5/5 Q5. Consider the following strategy: The State buys the K = $85.50, Jan2023 puts. Use a table of CF/barrel to describe the ICF/barrel, the cash flow at expiration and the P/L per barrel on Jan 2023 expiration from this strategy. Q6. Graph the P/L profile per barrel of the State's strategy from Q5., at Jan 2023 expiration
Step by Step Solution
There are 3 Steps involved in it

Get step-by-step solutions from verified subject matter experts