

Question: The department manager has decided that the appropriate forecasting model for the sales of laptops at a local electronics store is the Winter's Model with
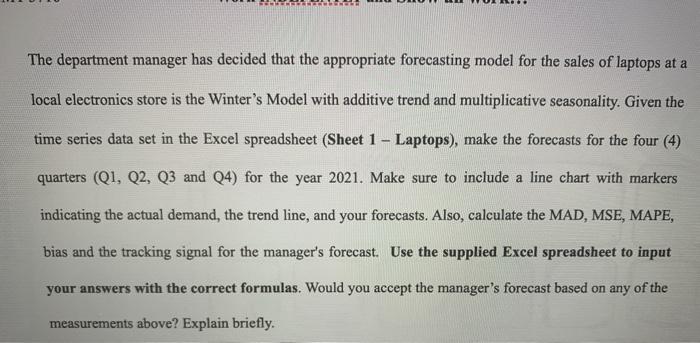
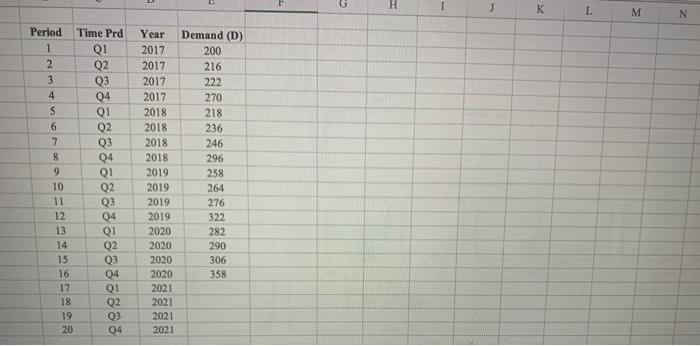
The department manager has decided that the appropriate forecasting model for the sales of laptops at a local electronics store is the Winter's Model with additive trend and multiplicative seasonality. Given the time series data set in the Excel spreadsheet (Sheet 1 - Laptops), make the forecasts for the four (4) quarters (Q1, Q2, Q3 and Q4) for the year 2021. Make sure to include a line chart with markers indicating the actual demand, the trend line, and your forecasts. Also, calculate the MAD, MSE, MAPE, bias and the tracking signal for the manager's forecast. Use the supplied Excel spreadsheet to input your answers with the correct formulas. Would you accept the manager's forecast based on any of the measurements above? Explain briefly. H J K L M N Period Time Prd 1 Q1 2 Q2 3 Q3 4 04 5 Q1 6 Q2 7 Q3 8 04 9 Q1 10 Q2 11 Q3 12 04 13 Q1 14 Q2 15 Q3 16 04 17 Q1 18 19 Q3 20 04 Year 2017 2017 2017 2017 2018 2018 2018 2018 2019 2019 2019 2019 2020 2020 2020 2020 2021 2021 2021 2021 Demand (D) 200 216 222 270 218 236 246 296 258 264 276 322 282 290 306 358 Q2 The department manager has decided that the appropriate forecasting model for the sales of laptops at a local electronics store is the Winter's Model with additive trend and multiplicative seasonality. Given the time series data set in the Excel spreadsheet (Sheet 1 - Laptops), make the forecasts for the four (4) quarters (Q1, Q2, Q3 and Q4) for the year 2021. Make sure to include a line chart with markers indicating the actual demand, the trend line, and your forecasts. Also, calculate the MAD, MSE, MAPE, bias and the tracking signal for the manager's forecast. Use the supplied Excel spreadsheet to input your answers with the correct formulas. Would you accept the manager's forecast based on any of the measurements above? Explain briefly. H J K L M N Period Time Prd 1 Q1 2 Q2 3 Q3 4 04 5 Q1 6 Q2 7 Q3 8 04 9 Q1 10 Q2 11 Q3 12 04 13 Q1 14 Q2 15 Q3 16 04 17 Q1 18 19 Q3 20 04 Year 2017 2017 2017 2017 2018 2018 2018 2018 2019 2019 2019 2019 2020 2020 2020 2020 2021 2021 2021 2021 Demand (D) 200 216 222 270 218 236 246 296 258 264 276 322 282 290 306 358 Q2
Step by Step Solution
There are 3 Steps involved in it

Get step-by-step solutions from verified subject matter experts