

The Department of Health of a certain state estimates a 10% rate of HIV for the...
Fantastic news! We've Found the answer you've been seeking!
Question:
Transcribed Image Text:
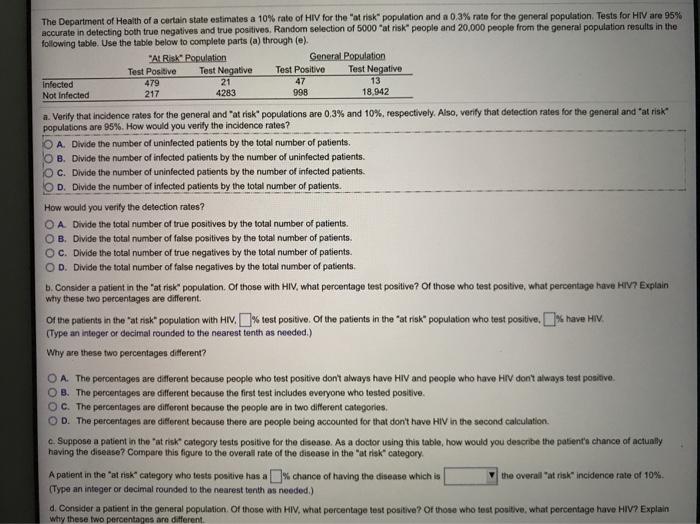
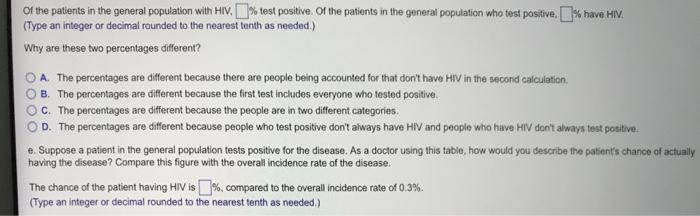
The Department of Health of a certain state estimates a 10% rate of HIV for the "at risk" population and a 0.3% rate for the general population. Tests for HIV are 95% accurate in detecting both true negatives and true positives. Random selection of 5000 "at risk" people and 20,000 people from the general population results in the following table. Use the table below to complete parts (a) through (e). "AL Risk Population Test Positive 479 217 Test Negative 21 4283 General Population Test Negative 13 18.942 Test Positive Infected Not Infected 47 998 a. Verify that incidence rates for the general and "at risk" populations are 0,3% and 10%, respectively. Also, verify that detection rates for the general and "at risk populations are 95%. How would you verify the incidence rates? A. Divide the number of uninfected patients by the total number of patients. O B. Divide the number of infected patients by the number of uninfected patients. OC. Divide the number of uninfected patients by the number of infected patients. O D. Divide the number of infected patients by the total number of patlents. How would you verify the detection rates? OA Divide the total number of true positives by the total number of patients. OB. Divide the total number of false positives by the total number of patients. OC. Divide the total number of true negatives by the total number of patients. O D. Divide the total number of false negatives by the total number of patients. b. Consider a patient in the "at risk" population. Or those with HIV, what percentage test positive? Of those who test positive, what percentage have HIV? Explain why these two percentages are different. Of the patients in the "at rak population with HIV. % test positive. Of the patients in the "at risk" population who test posive, k have HIV. (Type an integer or decimal rounded to the nearest tenth as needed.) Why are these two percentages different? OA. The percentages are different because people who test positive don't always have HIV and people who have HIV don't always test positive. OB. The percentages are different because the first test includes everyone who tested positive. OC. The percentages are different because the people are in two different categories, O D. The percentages are different because there are people being accounted for that don't have HIV in the second calculation. c. Suppose a patient in the "at risk" category tests positive for the disease. As a doctor using this table, how would you describe the patient's chance of actunly having the disease? Compare this figure to the overall rate of the disease in the "at risk" category. A patient in the "at risk" category who tests positive has a% chance of having the disease which is (Type an integer or decimal rounded to the nearest tenth as needed.) the overall "at risk" incidence rate of 10%. d. Consider a patient in the general population. Of those with HIV, what percentage test positive? Of those who test positive, what percentage have HIV? Explain why these two percentages are different. Of the patients in the general population with HIV. % test positive. Of the patients in the general population who test positive, % have HIV. (Type an integer or decimal rounded to the nearest tenth as needed.) Why are these two percentages different? O A. The percentages are different because there are people being accounted for that don't have HIV in the second calculation. O B. The percentages are different because the first test includes everyone who tested positive. C. The percentages are different because the people are in two different categories. D. The percentages are different because people who test positive dont always have HIV and people who have HIV don't always test positive. e. Suppose a patient in the general population tests positive for the disease. As a doctor using this table, how would you describe the patient's chance of actually having the disease? Compare this figure with the overall incidence rate of the disease. The chance of the patient having HIV is %. compared to the overall incidence rate of 0.3%. (Type an integer or decimal rounded to the nearest tenth as needed.) The Department of Health of a certain state estimates a 10% rate of HIV for the "at risk" population and a 0.3% rate for the general population. Tests for HIV are 95% accurate in detecting both true negatives and true positives. Random selection of 5000 "at risk" people and 20,000 people from the general population results in the following table. Use the table below to complete parts (a) through (e). "AL Risk Population Test Positive 479 217 Test Negative 21 4283 General Population Test Negative 13 18.942 Test Positive Infected Not Infected 47 998 a. Verify that incidence rates for the general and "at risk" populations are 0,3% and 10%, respectively. Also, verify that detection rates for the general and "at risk populations are 95%. How would you verify the incidence rates? A. Divide the number of uninfected patients by the total number of patients. O B. Divide the number of infected patients by the number of uninfected patients. OC. Divide the number of uninfected patients by the number of infected patients. O D. Divide the number of infected patients by the total number of patlents. How would you verify the detection rates? OA Divide the total number of true positives by the total number of patients. OB. Divide the total number of false positives by the total number of patients. OC. Divide the total number of true negatives by the total number of patients. O D. Divide the total number of false negatives by the total number of patients. b. Consider a patient in the "at risk" population. Or those with HIV, what percentage test positive? Of those who test positive, what percentage have HIV? Explain why these two percentages are different. Of the patients in the "at rak population with HIV. % test positive. Of the patients in the "at risk" population who test posive, k have HIV. (Type an integer or decimal rounded to the nearest tenth as needed.) Why are these two percentages different? OA. The percentages are different because people who test positive don't always have HIV and people who have HIV don't always test positive. OB. The percentages are different because the first test includes everyone who tested positive. OC. The percentages are different because the people are in two different categories, O D. The percentages are different because there are people being accounted for that don't have HIV in the second calculation. c. Suppose a patient in the "at risk" category tests positive for the disease. As a doctor using this table, how would you describe the patient's chance of actunly having the disease? Compare this figure to the overall rate of the disease in the "at risk" category. A patient in the "at risk" category who tests positive has a% chance of having the disease which is (Type an integer or decimal rounded to the nearest tenth as needed.) the overall "at risk" incidence rate of 10%. d. Consider a patient in the general population. Of those with HIV, what percentage test positive? Of those who test positive, what percentage have HIV? Explain why these two percentages are different. Of the patients in the general population with HIV. % test positive. Of the patients in the general population who test positive, % have HIV. (Type an integer or decimal rounded to the nearest tenth as needed.) Why are these two percentages different? O A. The percentages are different because there are people being accounted for that don't have HIV in the second calculation. O B. The percentages are different because the first test includes everyone who tested positive. C. The percentages are different because the people are in two different categories. D. The percentages are different because people who test positive dont always have HIV and people who have HIV don't always test positive. e. Suppose a patient in the general population tests positive for the disease. As a doctor using this table, how would you describe the patient's chance of actually having the disease? Compare this figure with the overall incidence rate of the disease. The chance of the patient having HIV is %. compared to the overall incidence rate of 0.3%. (Type an integer or decimal rounded to the nearest tenth as needed.)
Expert Answer:
Answer rating: 100% (QA)
a D Divide the number of infected patients by the total number ... View the full answer

Related Book For 

Probability & Statistics for Engineers & Scientists
ISBN: 978-0130415295
7th Edition
Authors: Ronald E. Walpole, Raymond H. Myers, Sharon L. Myers, Keying
Posted Date:
Students also viewed these accounting questions
-
In a study conducted by the Department of Health and Physical Education at the Virginia Polytechnic Institute and State University, 3 diets were assigned for a period of 3 days to each of 6 subjects...
-
The Department of Health and Human Services has proposed new guidelines for the interpretation of federal statutes on gifts, incentives, and other benefits bestowed on physicians by pharmaceutical...
-
The Department of Health and Human Services wants to know the average income of general assistance recipients. A sample of 60 recipients shows a sample mean of $ 17,400 with a standard deviation of $...
-
- You have identified several risks on your project for which purchasing insurance is a possibility. The insurance company your firm uses has quoted reasonable rates, and your analysis shows that...
-
What can any retailer learn from this case? Briefly.
-
A block (mass m1) lying on a frictionless inclined plane is connected to a mass m2 by a mass less cord passing over a pulley, as shown in Fig. 4-57. (a) Determine a formula for the acceleration of...
-
Plaintiffs James and Betty Tonkovich own approximately 850 acres of in Belmont County, Ohio. Plaintiffs belong to a group of landowners known as Belmont Leasing Group, which leases land for oil and...
-
Loss Contingencies: Entries and Essay on November 24, 2010, 26 passengers on Windsor Airlines Flight No. 901 were injured upon landing when the plane skidded off the runway. Personal injury suits for...
-
Pioneer Inc. wants to invest $557,302 today. The expected returns in years 1, 2, and 3 are $247,615, $180,383, and $335,481, respectively. If the rate of return on investment must be at least 14%,...
-
A beginning accounting student tried to complete a work sheet for Joyce Lee's Tax Service. The following adjusting entries were to have been analyzed and entered onto the work sheet. The work sheet...
-
How many times will the condition (current >=0) be checked in this loop? int total = 0; int current = 5; while (current >= 0 ) { } total total + current; current current - 2;
-
Why might a companys December 31 balance sheet differ from its June 30 balance sheet?
-
A firm will expand production by 200 units and must hire at least one additional worker. The marginal product per day for one additional unskilled worker is 100 units, and for one additional skilled...
-
A person or fi rm that performs services for another. a. 1099 b. employment a t w ill c. employment c ontract d. employee ha ndbook e. independent contractor f. respondeat superior g. W-2
-
What does the R 2 measure? What is the R 2 for a typical company?
-
Napster, Inc. provided a free service for visitors to its Web site that allowed users to share music digitally. Napster did not receive permission from the owners of the music. Several large...
-
As a result of sensitivity analysis, you ended up with the slope of the sensitivity graph with respect to first cost equal to - 5 0 . It means that Question 2 9 options: An increase in first...
-
In Exercises 1558, find each product. (9 - 5x) 2
-
In an article Shelf-Space Strategy in Retailing, published in the Proceedings: Southern Marketing Association, the effect of shelf height on the supermarket sales of canned dog food is investigated....
-
Referring to Exercise 4.35 find the mean and variance of the discrete random variable Z = 3X 2, when X represents the number of errors per 100 lines of code.
-
Consider the aggregate data of Example 13.1. Perform Bartlett's test to determine if there is heterogeneity of variance among the aggregates,
-
Define a sampling strategy.
-
Control is an important element in any type of research. Considering experimental research, come up with a hypothetical research scenario and apply each of the five types of control to the scenario....
-
Identify a hypothetical population .

Study smarter with the SolutionInn App