

Question: The diagram below represents the events in a MIMH queue during a period of time. The numbers on the horizontal axis represent time in seconds.
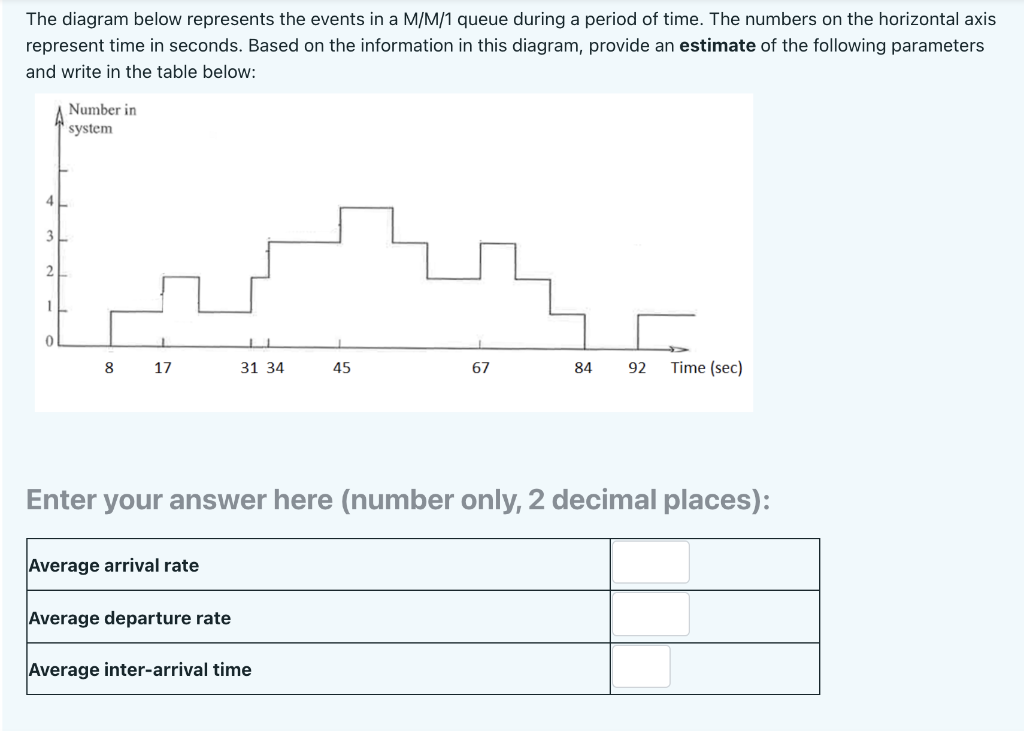
The diagram below represents the events in a MIMH queue during a period of time. The numbers on the horizontal axis represent time in seconds. Based on the information in this diagram, provide an estimate of the following parameters and write in the table below: N umber in system 8 17 31 34 45 67 84 92 Time (sec) Enter your answer here (number only, 2 decimal places): Average arrival rate Average departure rate _ Average inter-arrival time
Step by Step Solution
There are 3 Steps involved in it
1 Expert Approved Answer
Step: 1 Unlock

Question Has Been Solved by an Expert!
Get step-by-step solutions from verified subject matter experts
Step: 2 Unlock
Step: 3 Unlock