

Question: The diagram below shows an interferometer with two paths (Path A and Path B) which a wave can take from its source S to
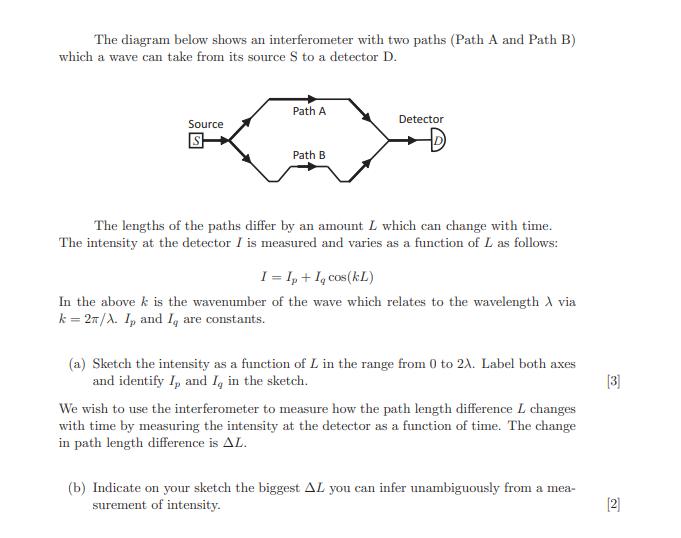
The diagram below shows an interferometer with two paths (Path A and Path B) which a wave can take from its source S to a detector D. Source S Path A Path B Detector The lengths of the paths differ by an amount L which can change with time. The intensity at the detector I is measured and varies as a function of L as follows: I = Ip + I, cos(kL) In the above k is the wavenumber of the wave which relates to the wavelength A via k= 2n/A. I, and I are constants. (a) Sketch the intensity as a function of L in the range from 0 to 2A. Label both axes and identify I, and I, in the sketch. We wish to use the interferometer to measure how the path length difference L changes with time by measuring the intensity at the detector as a function of time. The change in path length difference is AL. (b) Indicate on your sketch the biggest AL you can infer unambiguously from a mea- surement of intensity. [3] [2]
Step by Step Solution
3.42 Rating (155 Votes )
There are 3 Steps involved in it
a latensity 0 I ... View full answer

Get step-by-step solutions from verified subject matter experts