

Question: The diagram below, shows the costs for a typical (representative) firm in an industry with 100 identical firms. This industry experiences constant returns to scale.


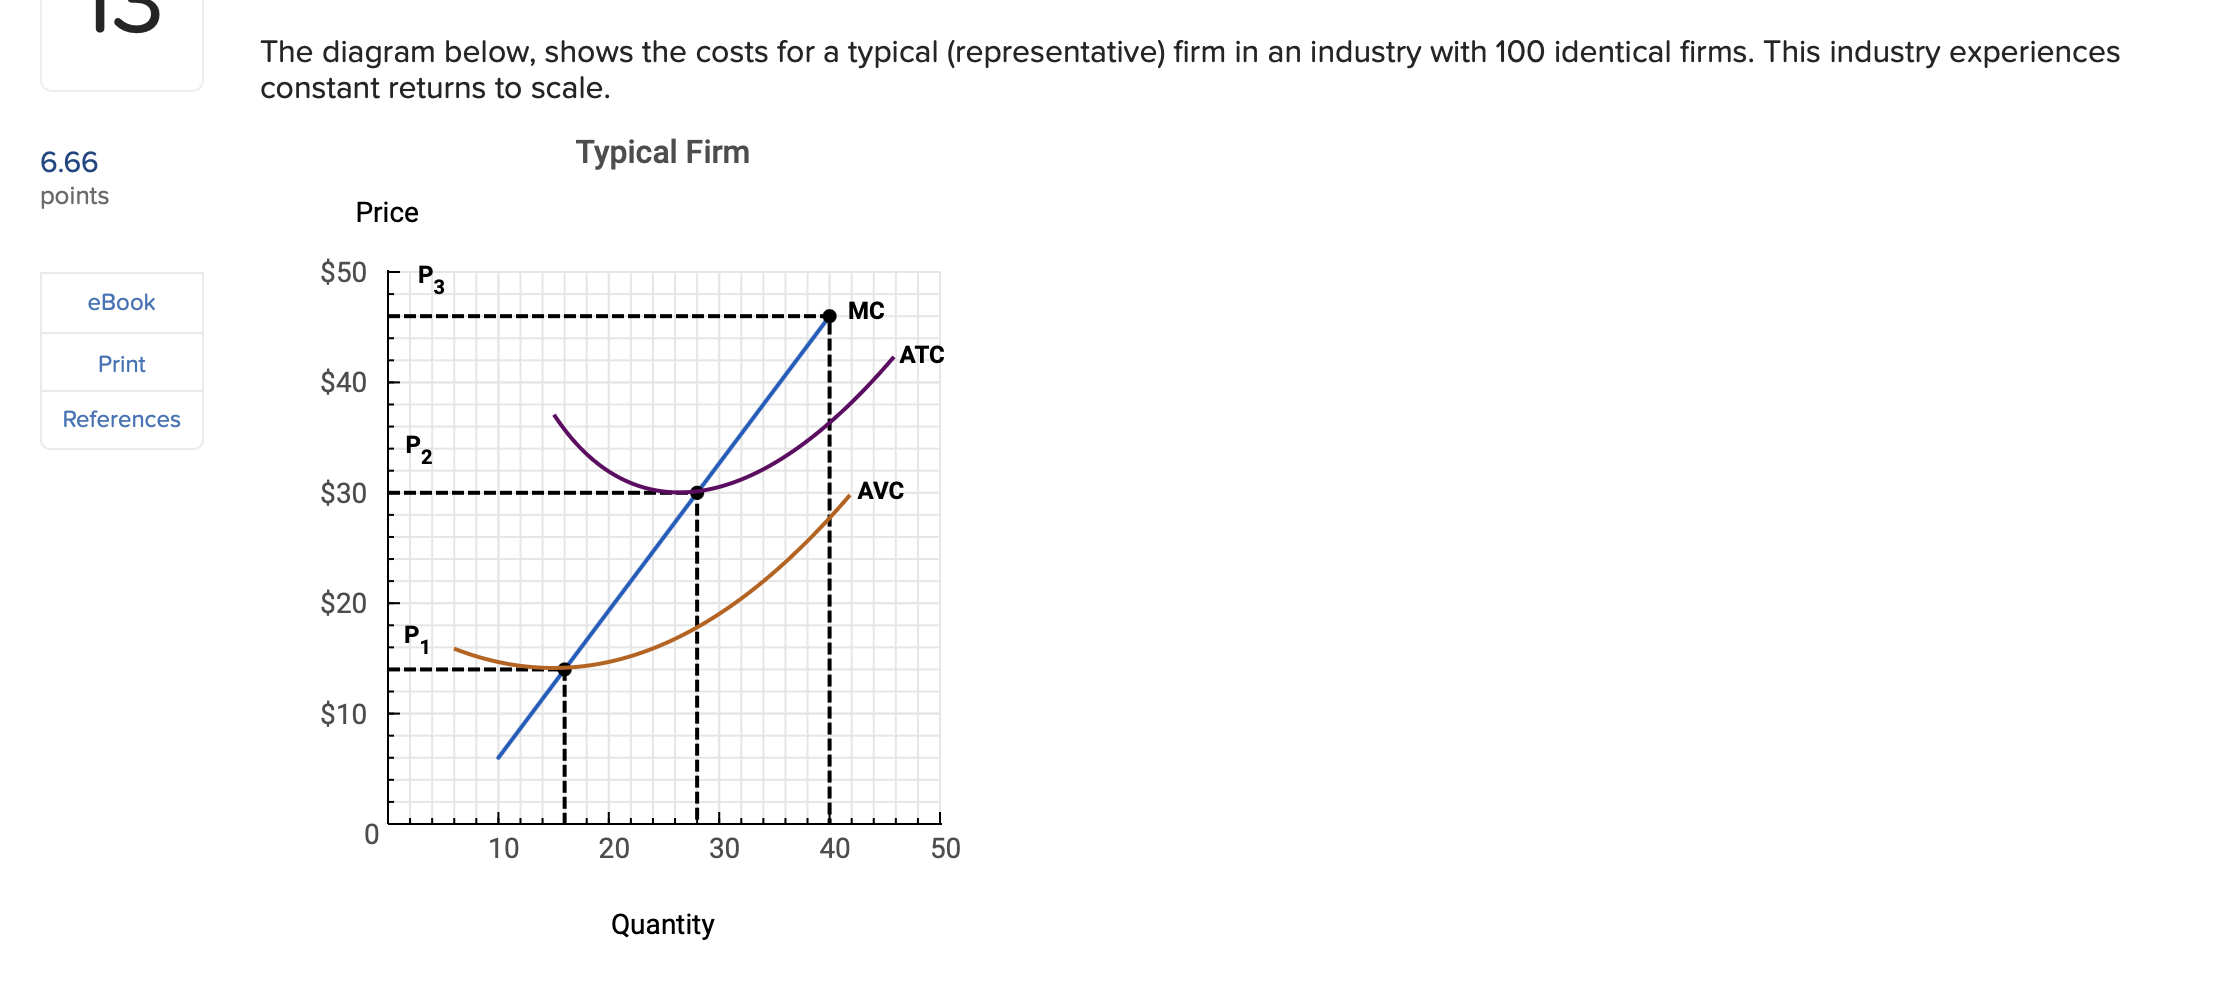
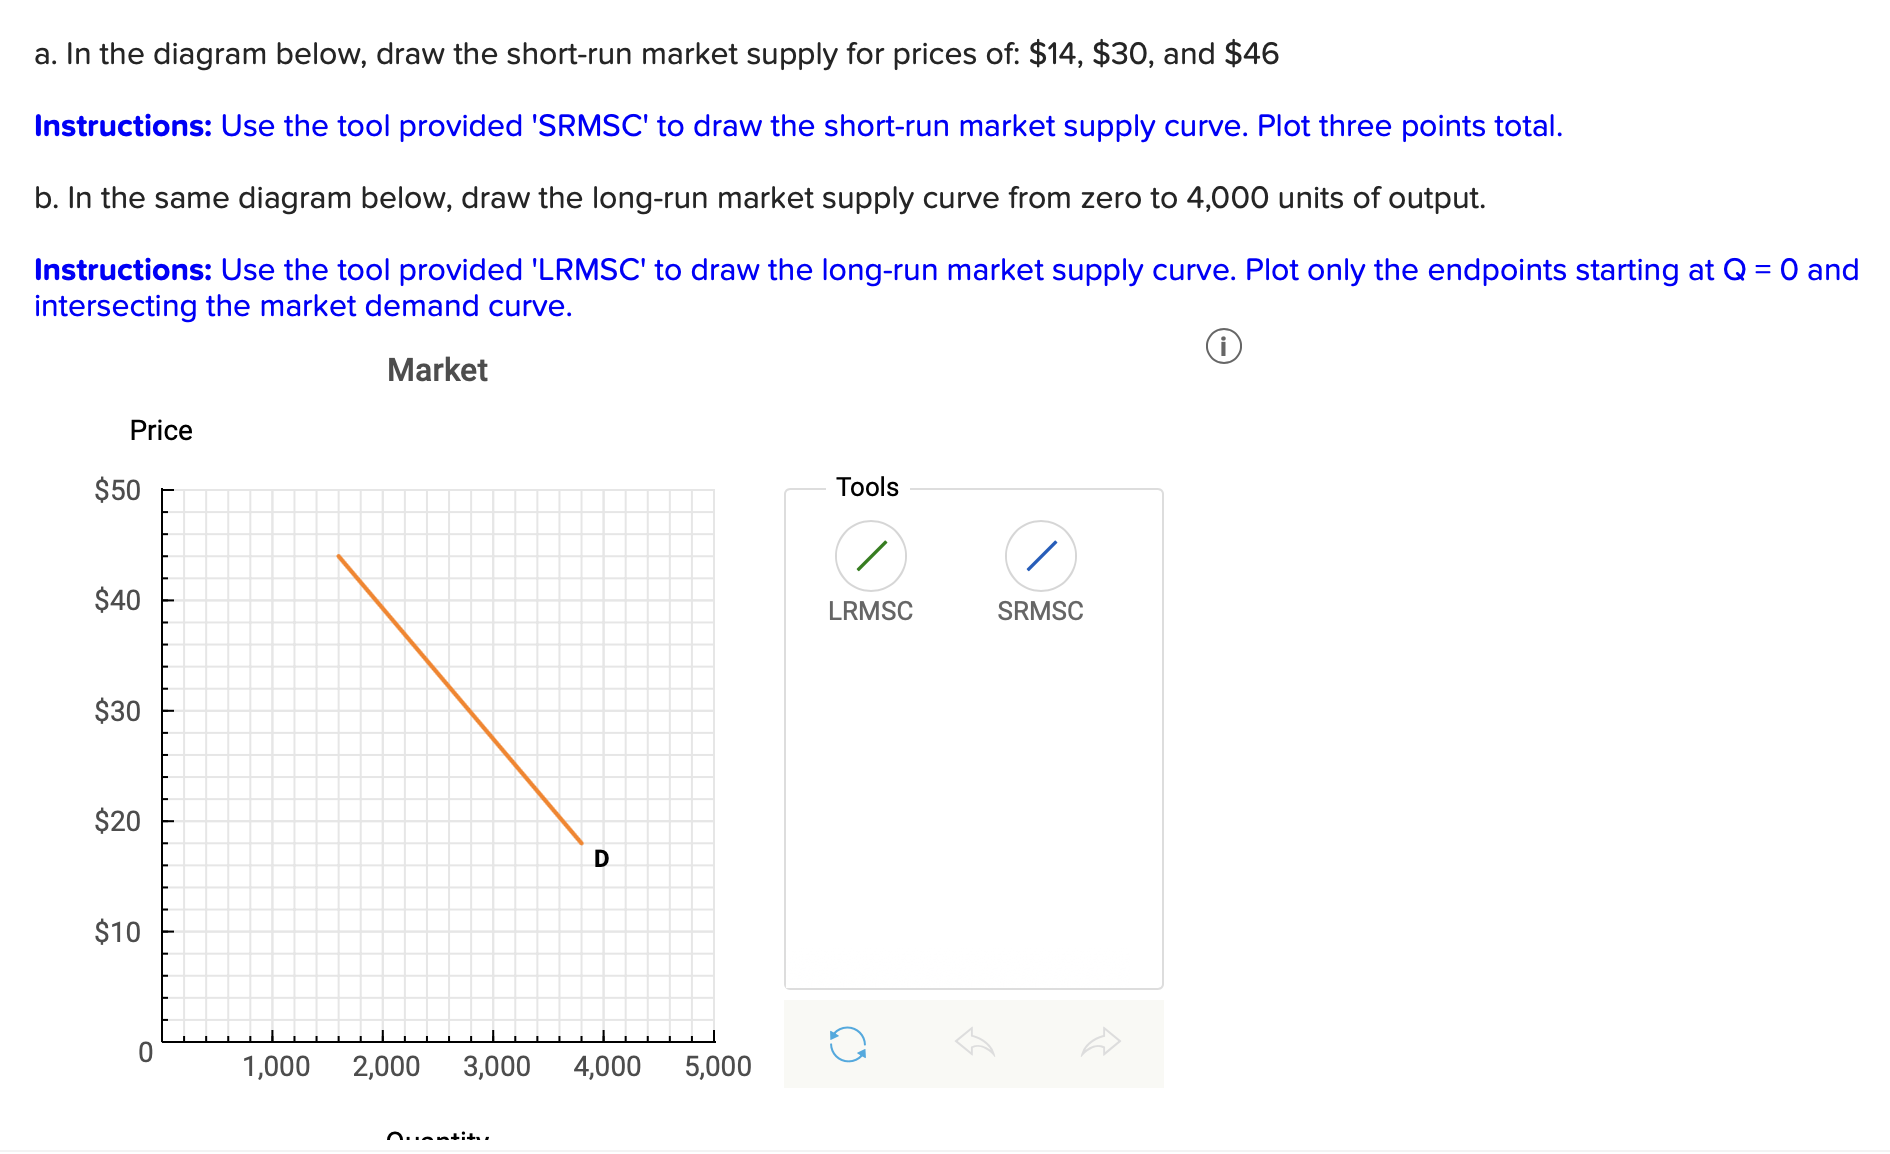
The diagram below, shows the costs for a typical (representative) firm in an industry with 100 identical firms. This industry experiences constant returns to scale. 6.66 Typical Firm points Price $50 - P3 eBook MC Print ATC $40 References P 2 $30 AVC $20 P $10 0 10 20 30 40 50 Quantitya. In the diagram below, draw the short-run market supply for prices of: $14, $30, and $46 Instructions: Use the tool provided 'SRMSC' to draw the short-run market supply curve' Plot three points total. b. In the same diagram below, draw the long-run market supply curve from zero to 4,000 units of output. Instructions: Use the tool provided 'LRMSC' to draw the long-run market supply curve Plot only the endpoints starting at Q = 0 and intersecting the market demand curve. Market Price Tools / / $40 ' LRMSC SRMSC $50 $30 _ $20 $10 . .III 1,000 2,000 3,000 4,000 5.000 A. ._._
Step by Step Solution
There are 3 Steps involved in it

Get step-by-step solutions from verified subject matter experts