

The diagram represents a perfectly competitive firm that faces a demand curve d. Answer the following questions.
Fantastic news! We've Found the answer you've been seeking!
Question:
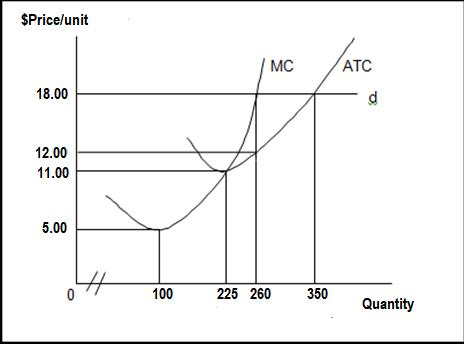
- The diagram represents a perfectly competitive firm that faces a demand curve d. Answer the following questions. Show all calculations. (25 points)
- a. From the diagram, how many units should this firm produce to maximize profit? (5pt)
- b. From the diagram data, calculate the firm’s total profit. (5pt)
- c. Assuming no changes in the costs of production, in the long run, how much will this firm produce, and at what price? (5pt)
- d. From the diagram, at what price will this firm break even? (5pt)
- e. From the diagram, at what price should this firm shut down? (5pt)
Expert Answer:
SOLUTION a To determine the profitmaximizing level of output the firm should produce where marginal cost MC equals marginal revenue MR which occurs at the quantity where the MC curve intersects the de... View the full answer

Related Book For 

Microeconomics
ISBN: 978-0321866349
14th canadian Edition
Authors: Christopher T.S. Ragan, Richard G Lipsey
Posted Date:
