

Question: The Distribution Function, F(2), and the Inventory I(Z), for the Standard Normal Distribution Function Z -4.0 -3.9 -3.8 -3.7 -3.6 -3.5 -3.4 -3.3 -3.2
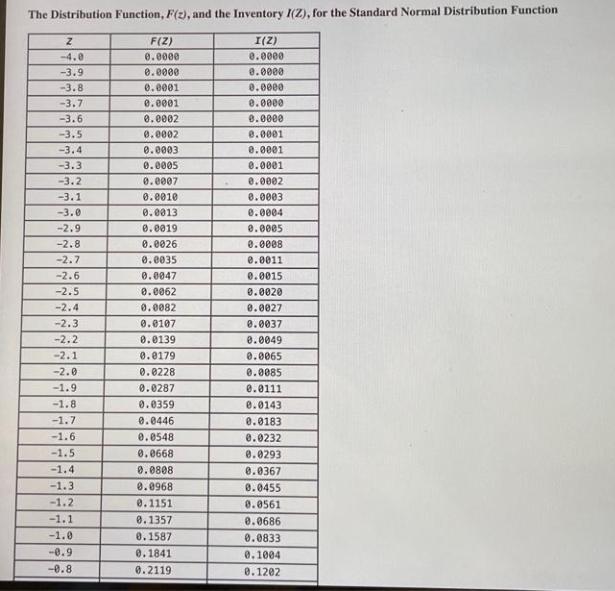
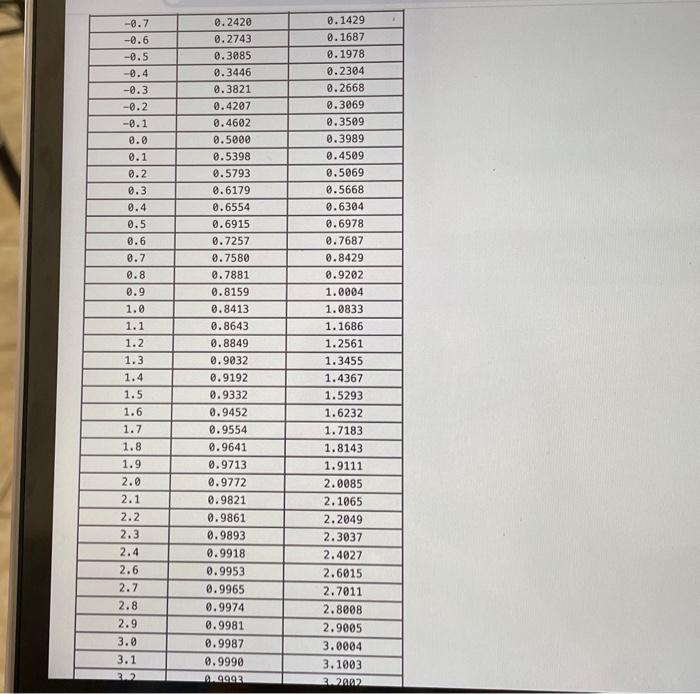
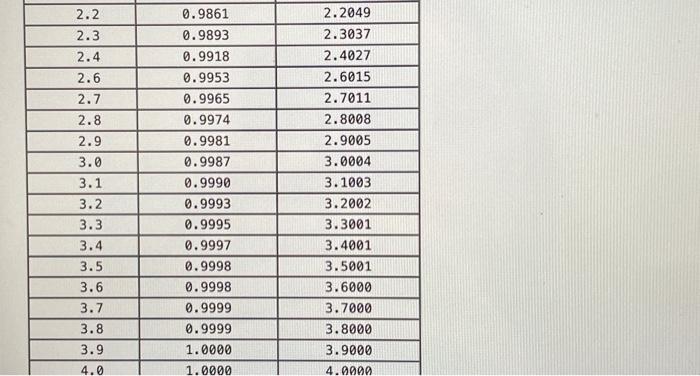
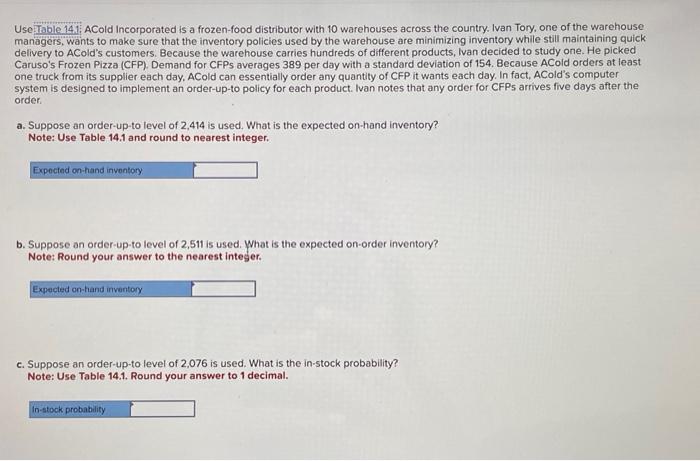
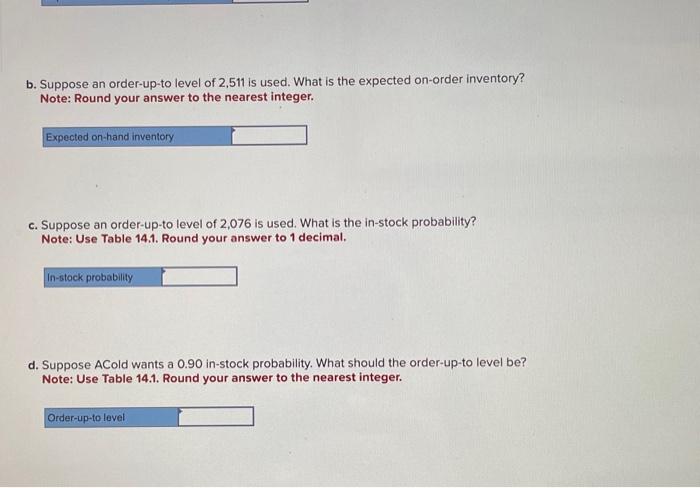
The Distribution Function, F(2), and the Inventory I(Z), for the Standard Normal Distribution Function Z -4.0 -3.9 -3.8 -3.7 -3.6 -3.5 -3.4 -3.3 -3.2 -3.1 -3.0 -2.9 -2.8 -2.7 -2.6 -2.5 -2.4 -2.3 -2.2 -2.1 -2.0 -1.9 -1.8 -1.7 -1.6 -1.5 -1.4 -1.3 -1.2 -1.1 -1.0 -0.9 -0.8 F(Z) 0.0000 0.0000 0.0001 0.0001 0.0002 0.0002 0.0003 0.0005 0.0007 0.0010 0.0013 0.0019 0.0026 0.0035 0.0047 0.0062 0.0082 0.0107 0.0139 0.0179 0.0228 0.0287 0.0359 0.0446 0.0548 0.0668 0.0808 0.0968 0.1151 0.1357 0.1587 0.1841 0.2119 I(Z) 0.0000 0.0000 0.0000 0.0000 0.0000 0.0001 0.0001 0.0001 0.0002 0.0003 0.0004 0.0005 0.0008 0.0011 0.0015 0.0020 0.0027 0.0037 0.0049 0.0065 0.0085 0.0111 0.0143 0.0183 0.0232 0.0293 0.0367 0.0455 0.0561 0.0686 0.0833 0.1004 0.1202 -0.7 -0.6 -0.5 -0.4 -0.3 -0.2 -0.1 0.0 0.1 0.2 0.3 0.4 0.5 0.6 8.7 0.8 0.9 1.0 1.1 1.2 1.3 1.4 1.5 1.6 1.7 1.8 1.9 2.0 2.1 2.2 2.3 2.4 2.6 2.7 2.8 2.9 3.0 3.1 3.2 0.2420 0.2743 0.3085 0.3446 0.3821 0.4207 0.4602 0.5000 0.5398 0.5793 0.6179 0.6554 0.6915 0.7257 0.7580 0.7881 0.8159 0.8413 0.8643 0.8849 0.9032 0.9192 0.9332 0.9452 0.9554 0.9641 0.9713 0.9772 0.9821 0.9861 0.9893 0.9918 0.9953 0.9965 0.9974 0.9981 0.9987 0.9990 .03 0.1429 0.1687 0.1978 0.2304 0.2668 0.3069 0.3509 0.3989 0.4509 0.5069 0.5668 0.6304 0.6978 0.7687 0.8429 8.9202 1.0004 1.0833 1.1686 1.2561 1.3455. 1.4367 1.5293 1.6232 1.7183 1.8143 1.9111 2.0085 2.1065 2.2049 2.3037 2.4027 2.6015 2.7011 2.8008 2.9005 3.0004 3.1003 3.2002 2.2 2.3 2.4 2.6 2.7 2.8 2.9 3.0 3.1 3.2 3.3 3.4 3.5 3.6 3.7 3.8 3.9 4.0 0.9861 0.9893 0.9918 0.9953 0.9965 0.9974 0.9981 0.9987 0.9990 0.9993 0.9995 0.9997 0.9998 0.9998 0.9999 0.9999 1.0000 1.0000 2.2049 2.3037 2.4027 2.6015 2.7011 2.8008 2.9005 3.0004 3.1003 3.2002 3.3001 3.4001 3.5001 3.6000 3.7000 3.8000 3.9000 4.0000 Use Table 14.1 ACold Incorporated is a frozen-food distributor with 10 warehouses across the country. Ivan Tory, one of the warehouse managers, wants to make sure that the inventory policies used by the warehouse are minimizing inventory while still maintaining quick delivery to ACold's customers. Because the warehouse carries hundreds of different products, Ivan decided to study one. He picked Caruso's Frozen Pizza (CFP). Demand for CFPs averages 389 per day with a standard deviation of 154. Because ACold orders at least one truck from its supplier each day. ACold can essentially order any quantity of CFP it wants each day. In fact, ACold's computer system is designed to implement an order-up-to policy for each product. Ivan notes that any order for CFPs arrives five days after the order. a. Suppose an order-up-to level of 2,414 is used. What is the expected on-hand inventory? Note: Use Table 14.1 and round to nearest integer. Expected on-hand inventory b. Suppose an order-up-to level of 2,511 is used. What is the expected on-order inventory? Note: Round your answer to the nearest integer. Expected on-hand inventory c. Suppose an order-up-to level of 2,076 is used. What is the in-stock probability? Note: Use Table 14.1. Round your answer to 1 decimal. In-stock probability b. Suppose an order-up-to level of 2,511 is used. What is the expected on-order inventory? Note: Round your answer to the nearest integer. Expected on-hand inventory c. Suppose an order-up-to level of 2,076 is used. What is the in-stock probability? Note: Use Table 14.1. Round your answer to 1 decimal. In-stock probability d. Suppose ACold wants a 0.90 in-stock probability. What should the order-up-to level be? Note: Use Table 14.1. Round your answer to the nearest integer. Order-up-to level
Step by Step Solution
There are 3 Steps involved in it
Answer To answer the questions we need to use the information provided and make calculations based on the given data a The expected onhand inventory can be calculated by subtracting the average demand ... View full answer

Get step-by-step solutions from verified subject matter experts