

Question: The distribution given in Table M represents cases of cabbage sold by Paul over a 42-week period of sales in the Farmer's Market down town
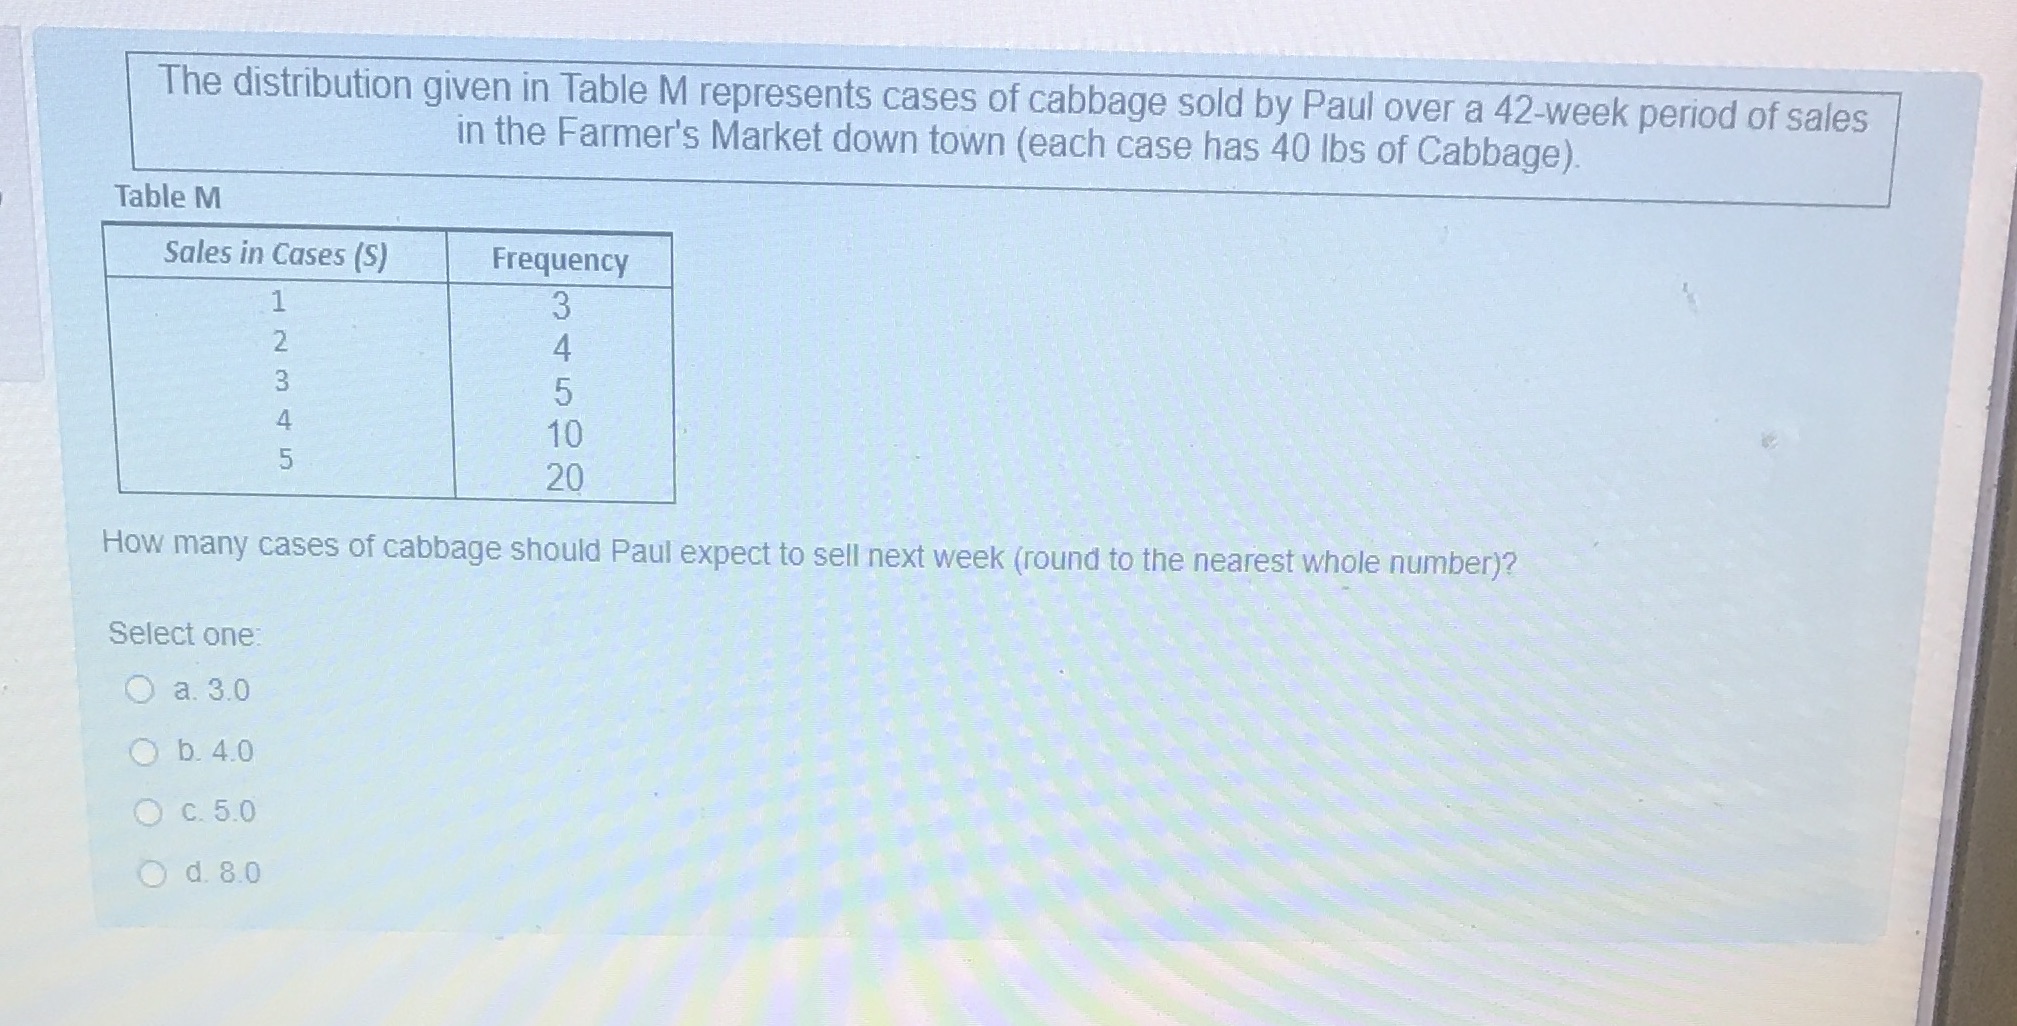
The distribution given in Table M represents cases of cabbage sold by Paul over a 42-week period of sales in the Farmer's Market down town (each case has 40 lbs of Cabbage). Table M Sales in Cases (S) Frequency AWNI 5 10 5 20 How many cases of cabbage should Paul expect to sell next week (round to the nearest whole number)? Select one: O a. 3.0 O b. 4.0 O C. 5.0 O d. 8.0
Step by Step Solution
There are 3 Steps involved in it
1 Expert Approved Answer
Step: 1 Unlock

Question Has Been Solved by an Expert!
Get step-by-step solutions from verified subject matter experts
Step: 2 Unlock
Step: 3 Unlock