

Question: The dot plot below shows the sizes for five classes with a mean of 44 and standard deviation of 8. The dynamic equation shows the
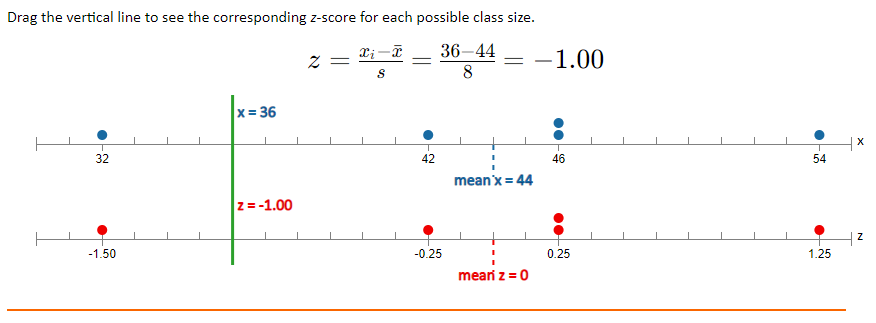
The dot plot below shows the sizes for five classes with a mean of 44 and standard deviation of 8. The dynamic equation shows the mathematical conversion to z-scores in real time.
Drag the vertical line to see the corresponding z-score for each possible class size.
\large z = {x_i - \bar x \over s } = {{36 - 44 \over 8} = -1.00 }z=?s??x?i????x?????=?8??36?44??=?1.00
32424654-1.50-0.250.251.25x = 36z = -1.00xzmean x = 44mean z = 0
Question Workspace
Step by Step Solution
There are 3 Steps involved in it
1 Expert Approved Answer
Step: 1 Unlock

Question Has Been Solved by an Expert!
Get step-by-step solutions from verified subject matter experts
Step: 2 Unlock
Step: 3 Unlock