

Question: The dot plots below show two sampling distributions The dotplots below show two sampling distributions of the average year of a penny for 500 samples.
The dot plots below show two sampling distributions
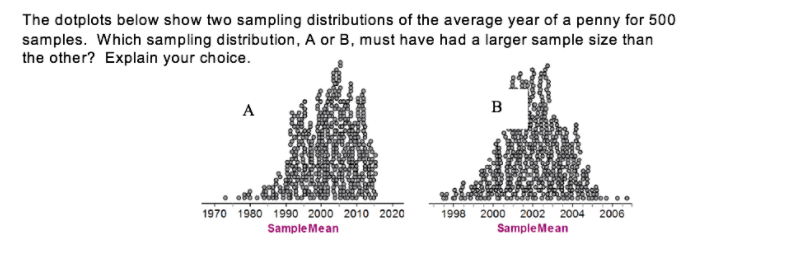
The dotplots below show two sampling distributions of the average year of a penny for 500 samples. Which sampling distribution, A or B, must have had a larger sample size than the other? Explain your choice. A B 1970 1980 1990 2000 2010 2020 1998 2000 2002 2004 2006 Sample Mean Sample Mean
Step by Step Solution
There are 3 Steps involved in it
1 Expert Approved Answer
Step: 1 Unlock

Question Has Been Solved by an Expert!
Get step-by-step solutions from verified subject matter experts
Step: 2 Unlock
Step: 3 Unlock