

Question: The dotplot below displays the points scored per game by 35 NBA players during the 2017 basketball season. ... : 8. . 8. 8 .
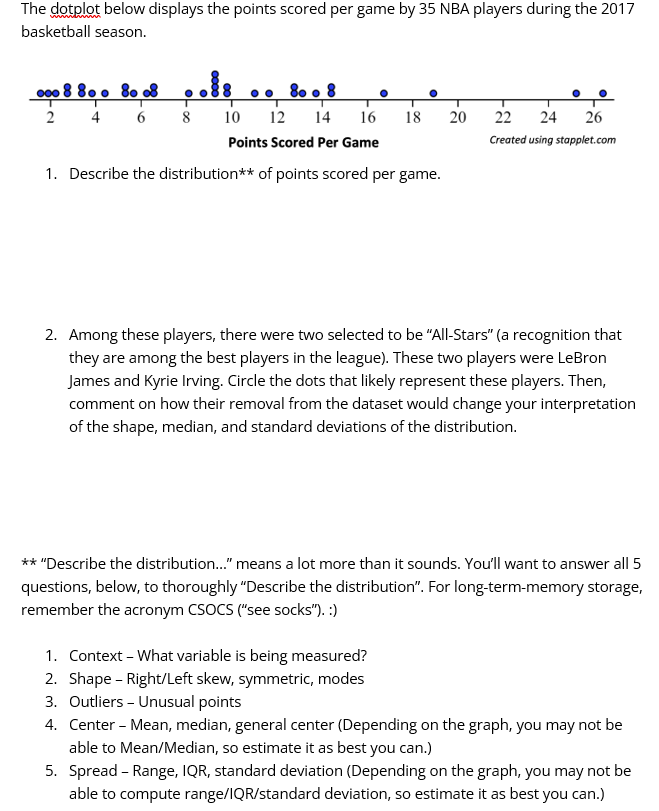

The dotplot below displays the points scored per game by 35 NBA players during the 2017 basketball season. ... : 8. . 8. 8 . .8 .. 8. . 8 6 8 10 12 14 16 18 20 22 24 26 Points Scored Per Game Created using stapplet.com 1. Describe the distribution** of points scored per game. 2. Among these players, there were two selected to be "All-Stars" (a recognition that they are among the best players in the league). These two players were LeBron James and Kyrie Irving. Circle the dots that likely represent these players. Then, comment on how their removal from the dataset would change your interpretation of the shape, median, and standard deviations of the distribution. ** "Describe the distribution..." means a lot more than it sounds. You'll want to answer all 5 questions, below, to thoroughly "Describe the distribution". For long-term-memory storage, remember the acronym CSOCS ("see socks"). :) 1. Context - What variable is being measured? 2. Shape - Right/Left skew, symmetric, modes 3. Outliers - Unusual points 4. Center - Mean, median, general center (Depending on the graph, you may not be able to Mean/Median, so estimate it as best you can.) 5. Spread - Range, IQR, standard deviation (Depending on the graph, you may not be able to compute range/IQR/standard deviation, so estimate it as best you can.)
Step by Step Solution
There are 3 Steps involved in it

Get step-by-step solutions from verified subject matter experts