

Question: The dotplot below shows ages for 46 Math 125 students in Spring 2020: 20 25 30 35 40 45 50 age How many students were
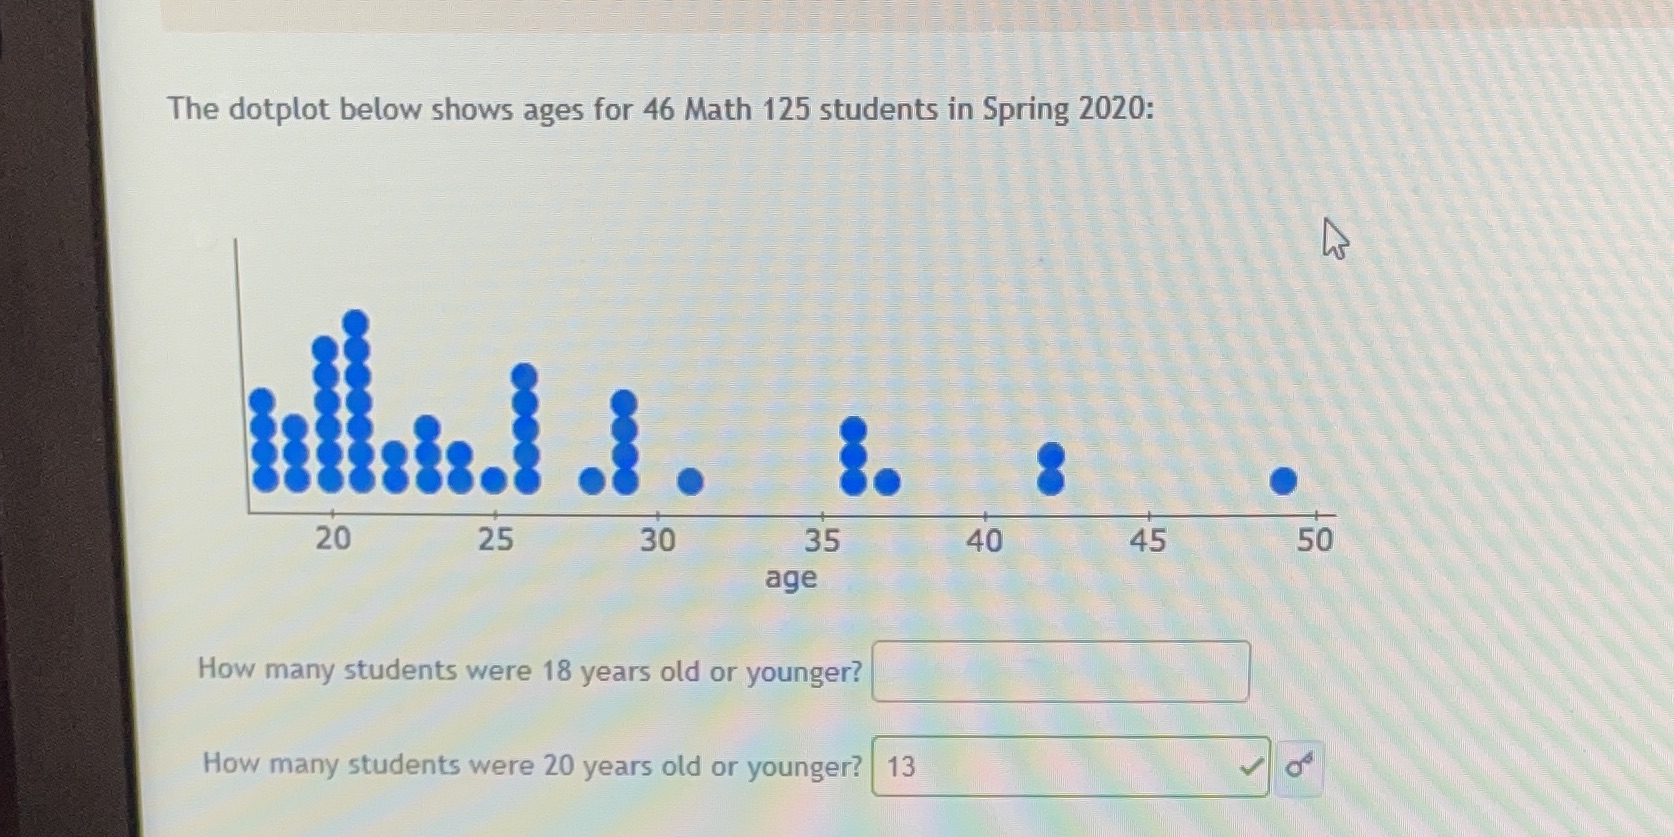
The dotplot below shows ages for 46 Math 125 students in Spring 2020: 20 25 30 35 40 45 50 age How many students were 18 years old or younger? How many students were 20 years old or younger? 13
Step by Step Solution
There are 3 Steps involved in it
1 Expert Approved Answer
Step: 1 Unlock

Question Has Been Solved by an Expert!
Get step-by-step solutions from verified subject matter experts
Step: 2 Unlock
Step: 3 Unlock