

Question: The dotplot displays the distribution of height for WNBA players during the 2017 season. Describe the shape of the distribution. 64 66 68 70 72
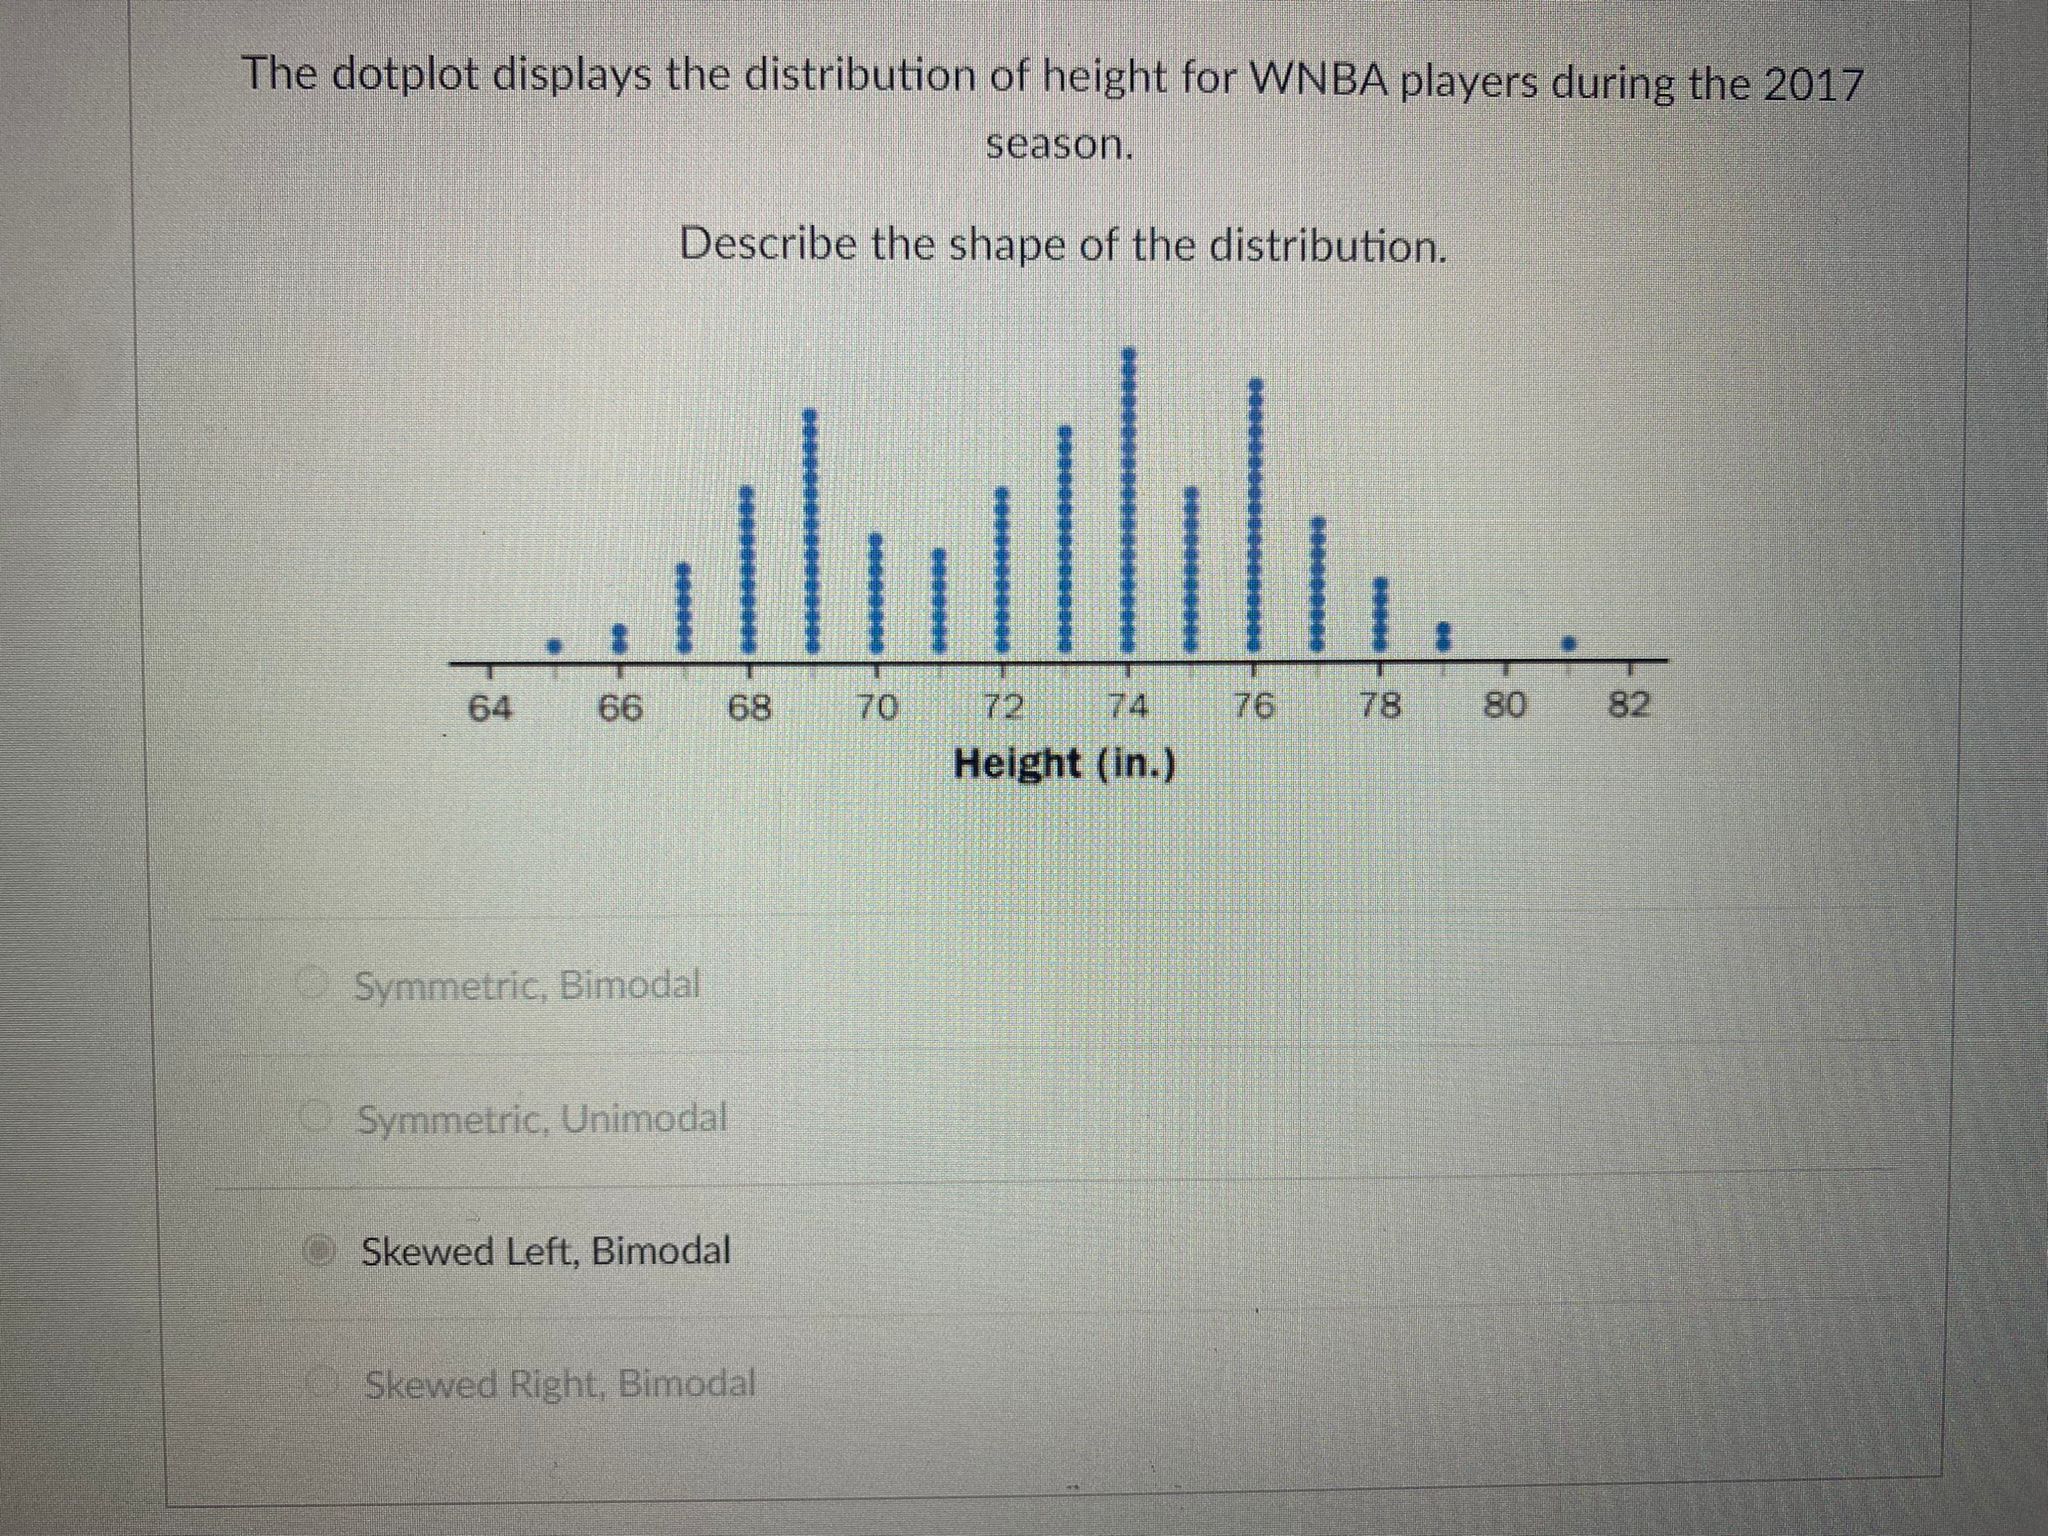
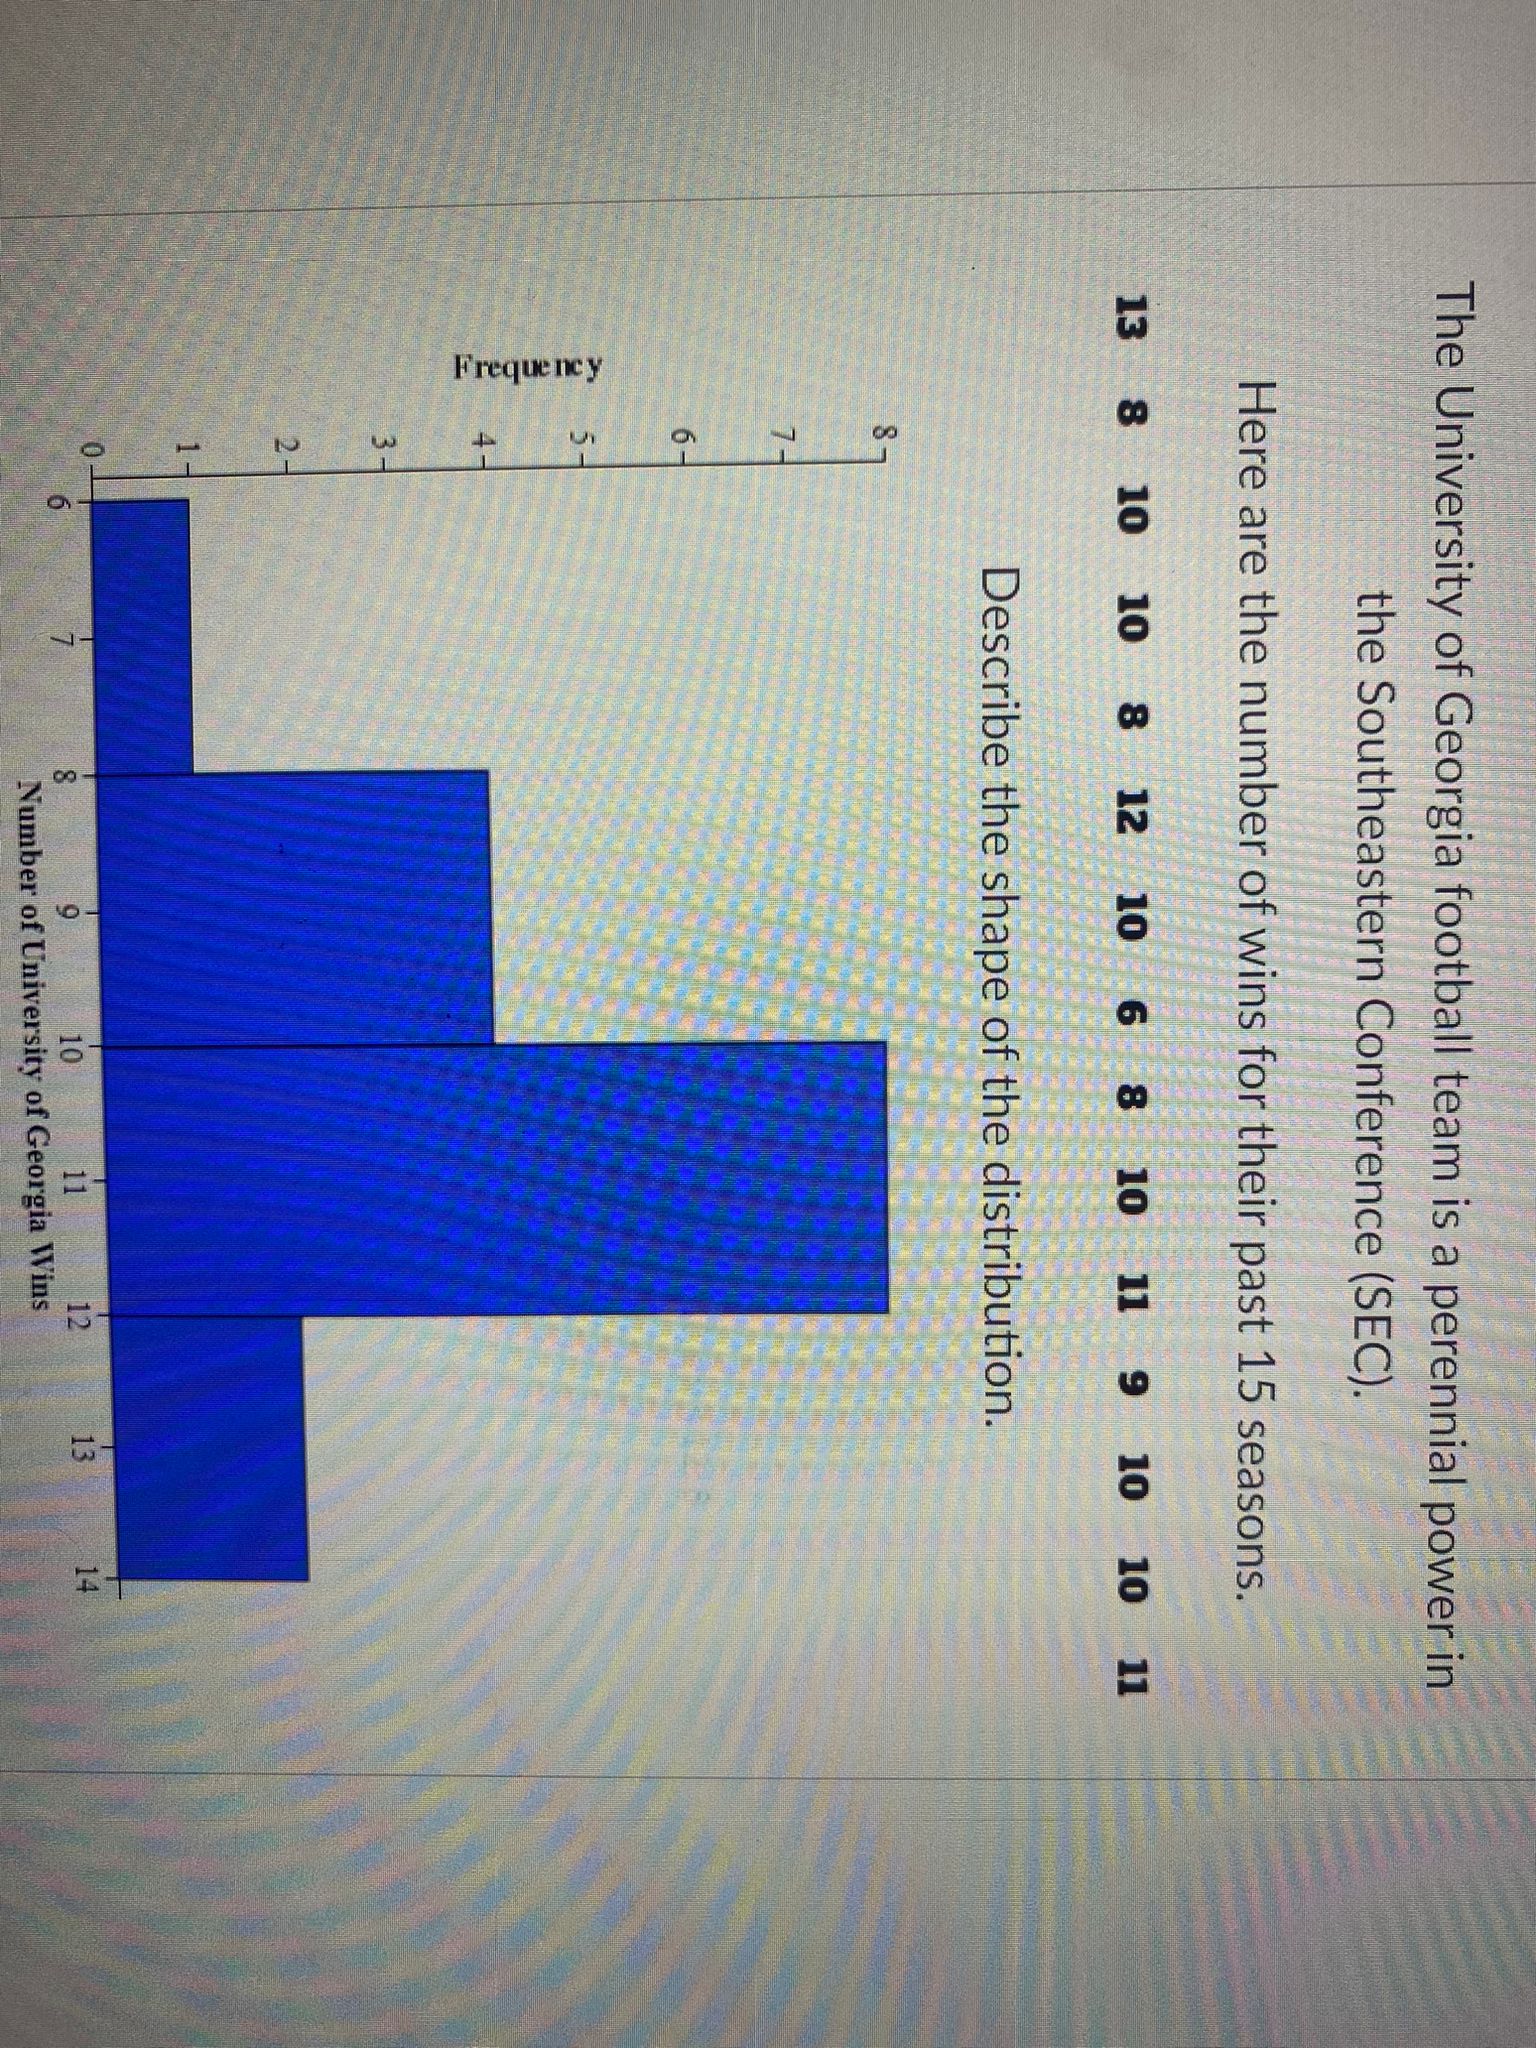
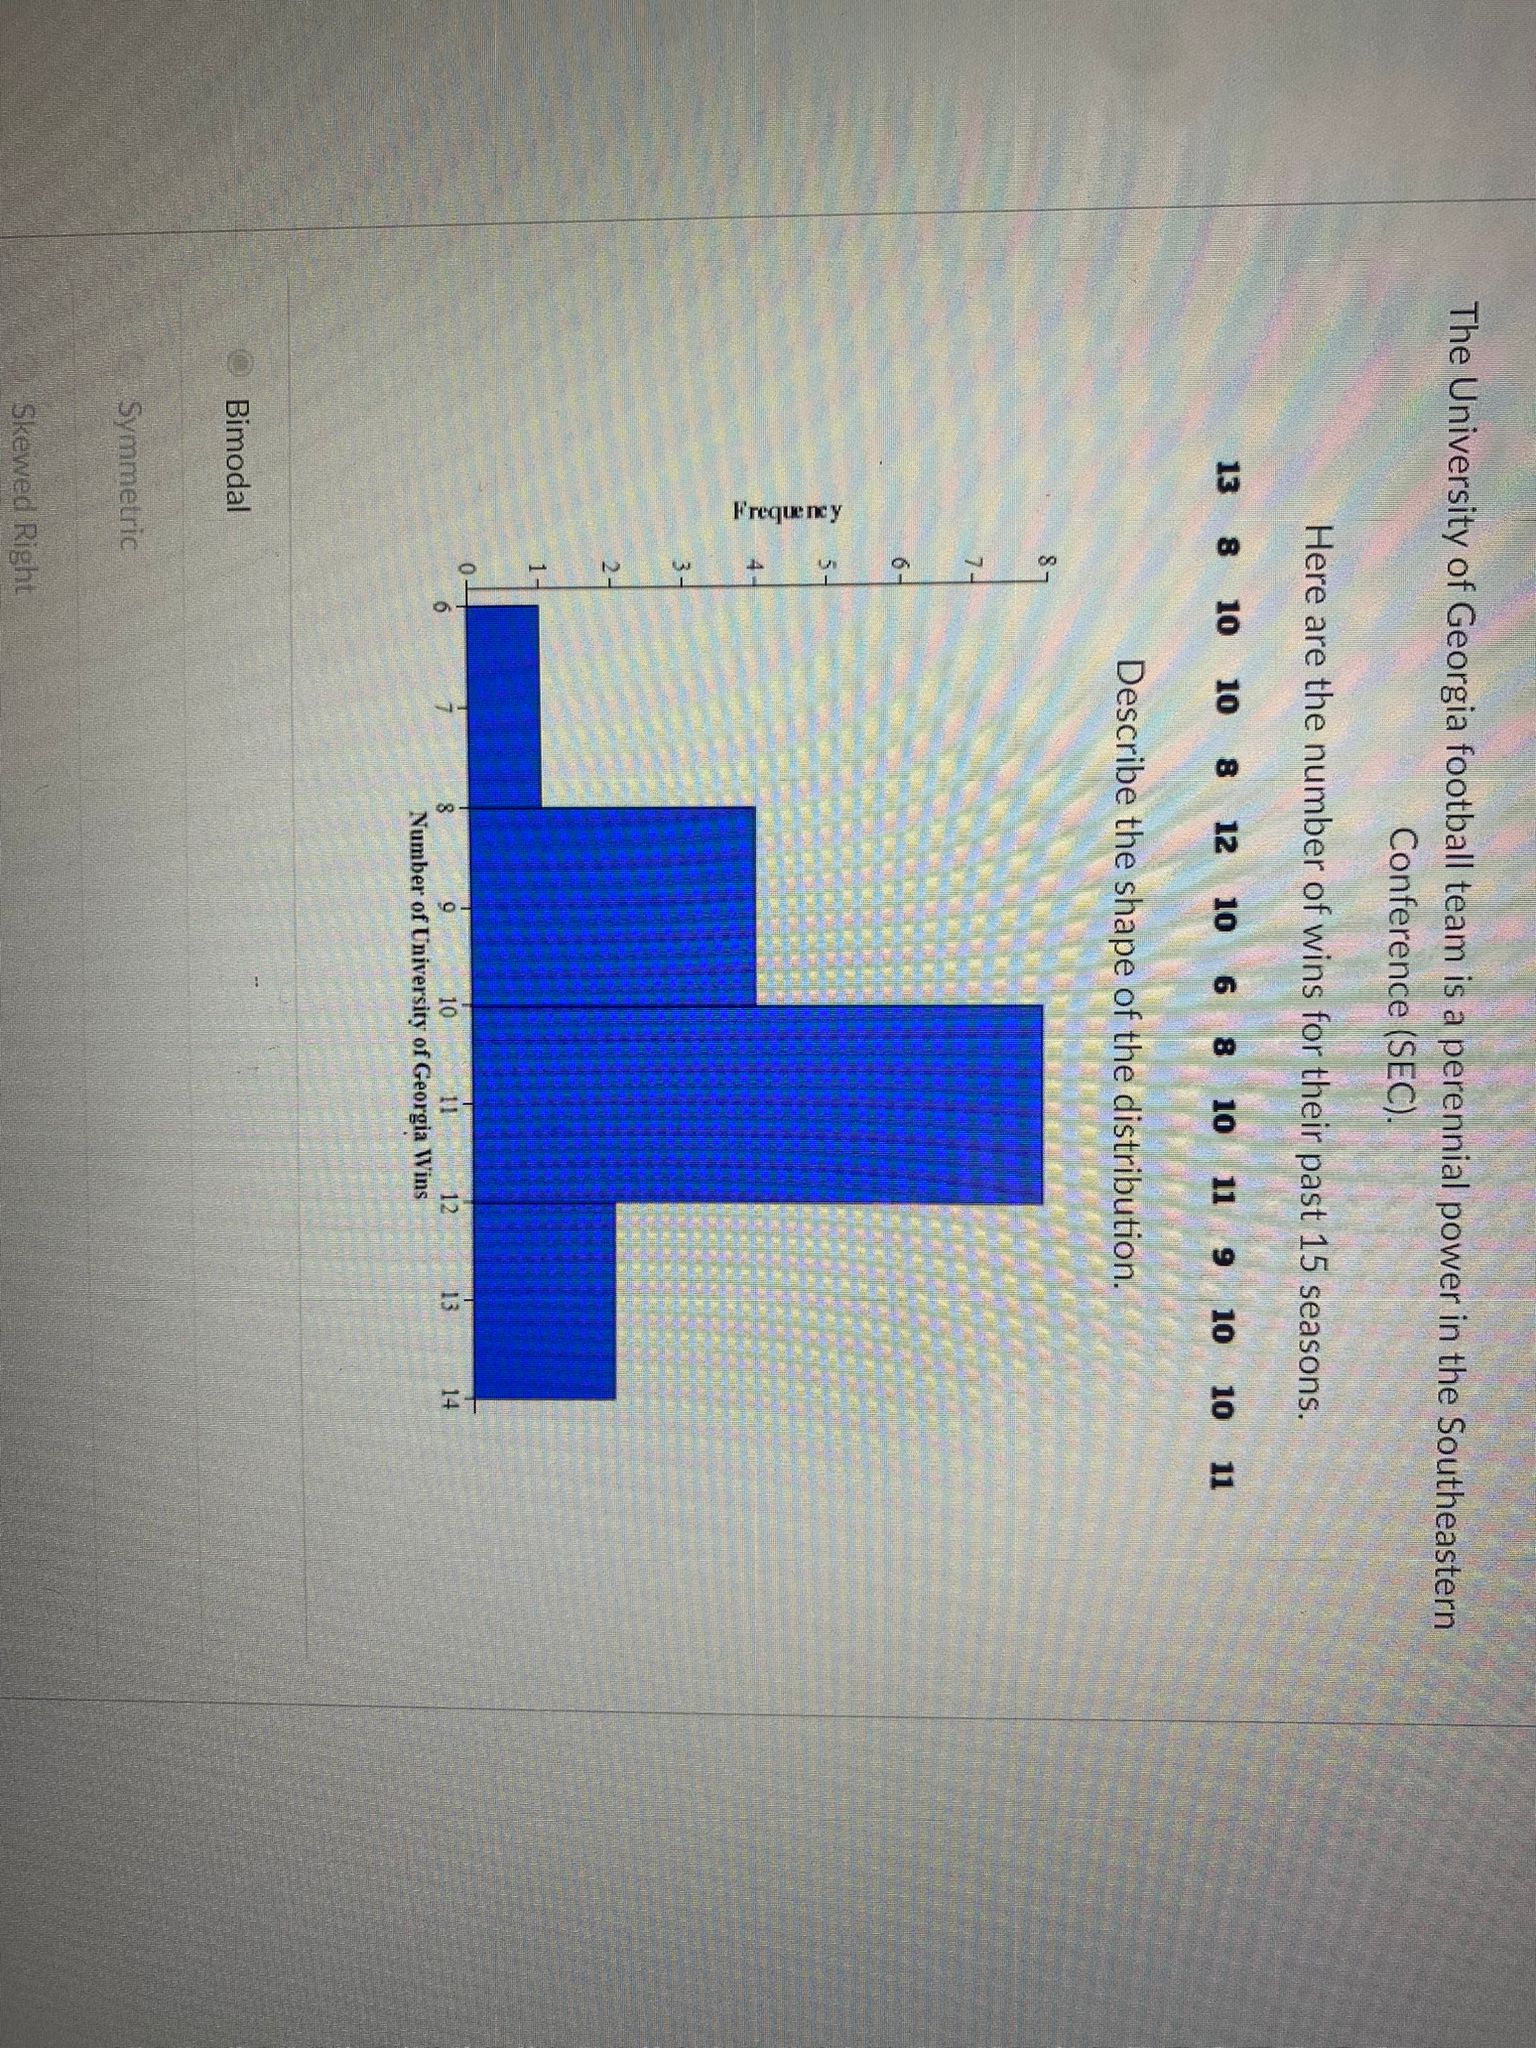
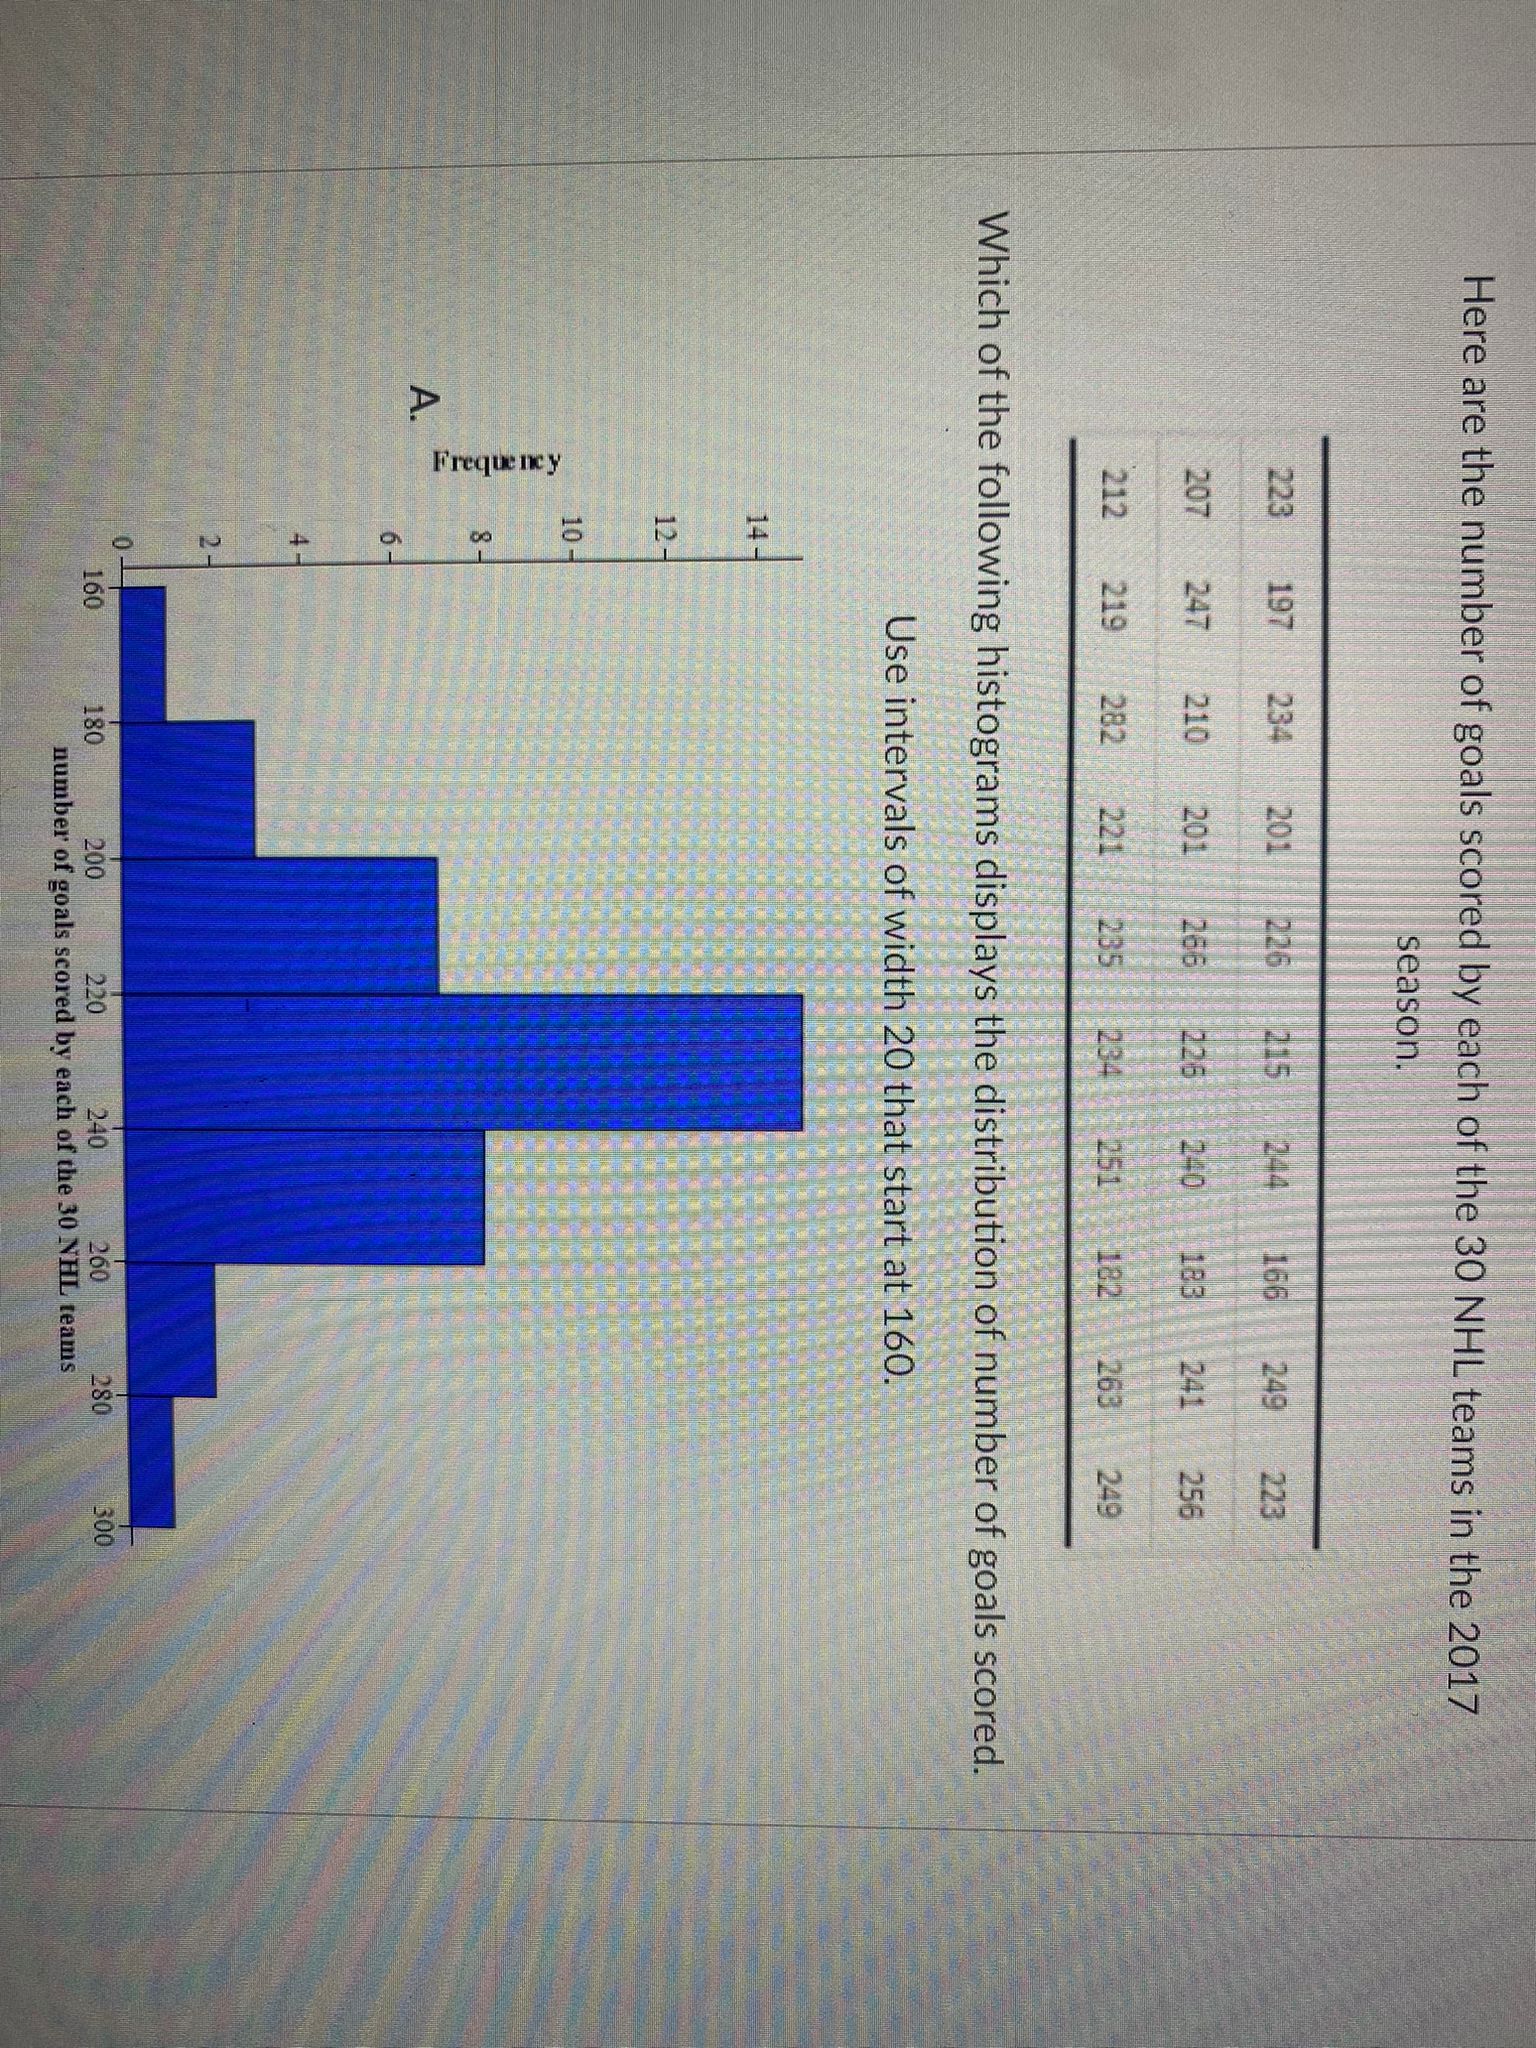
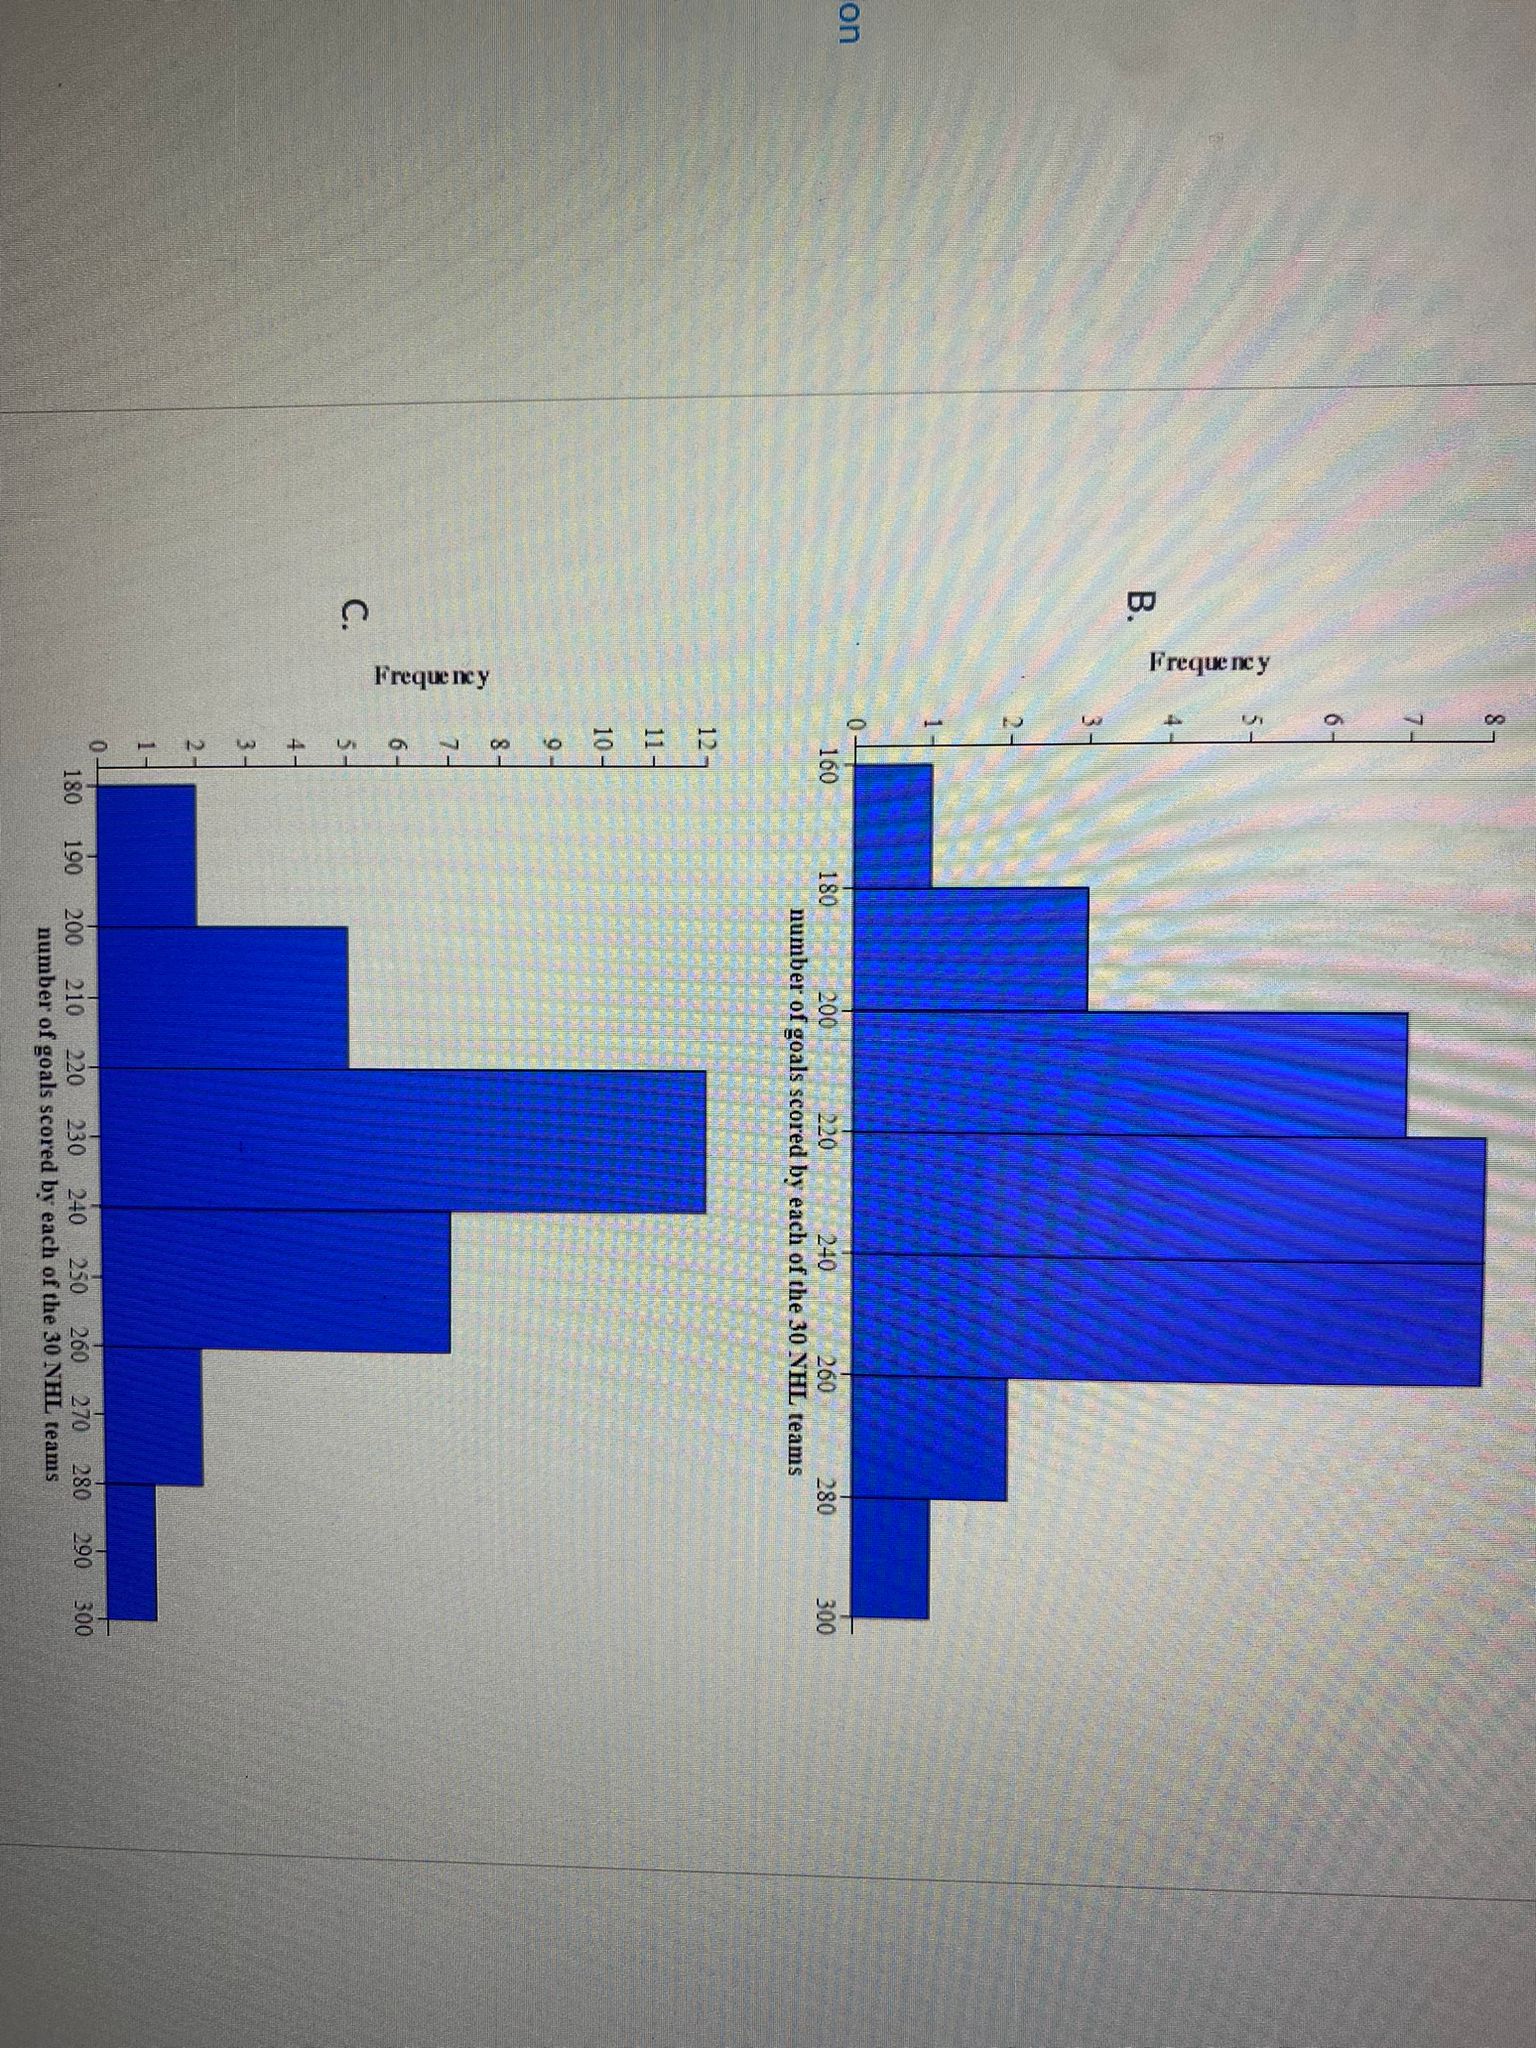
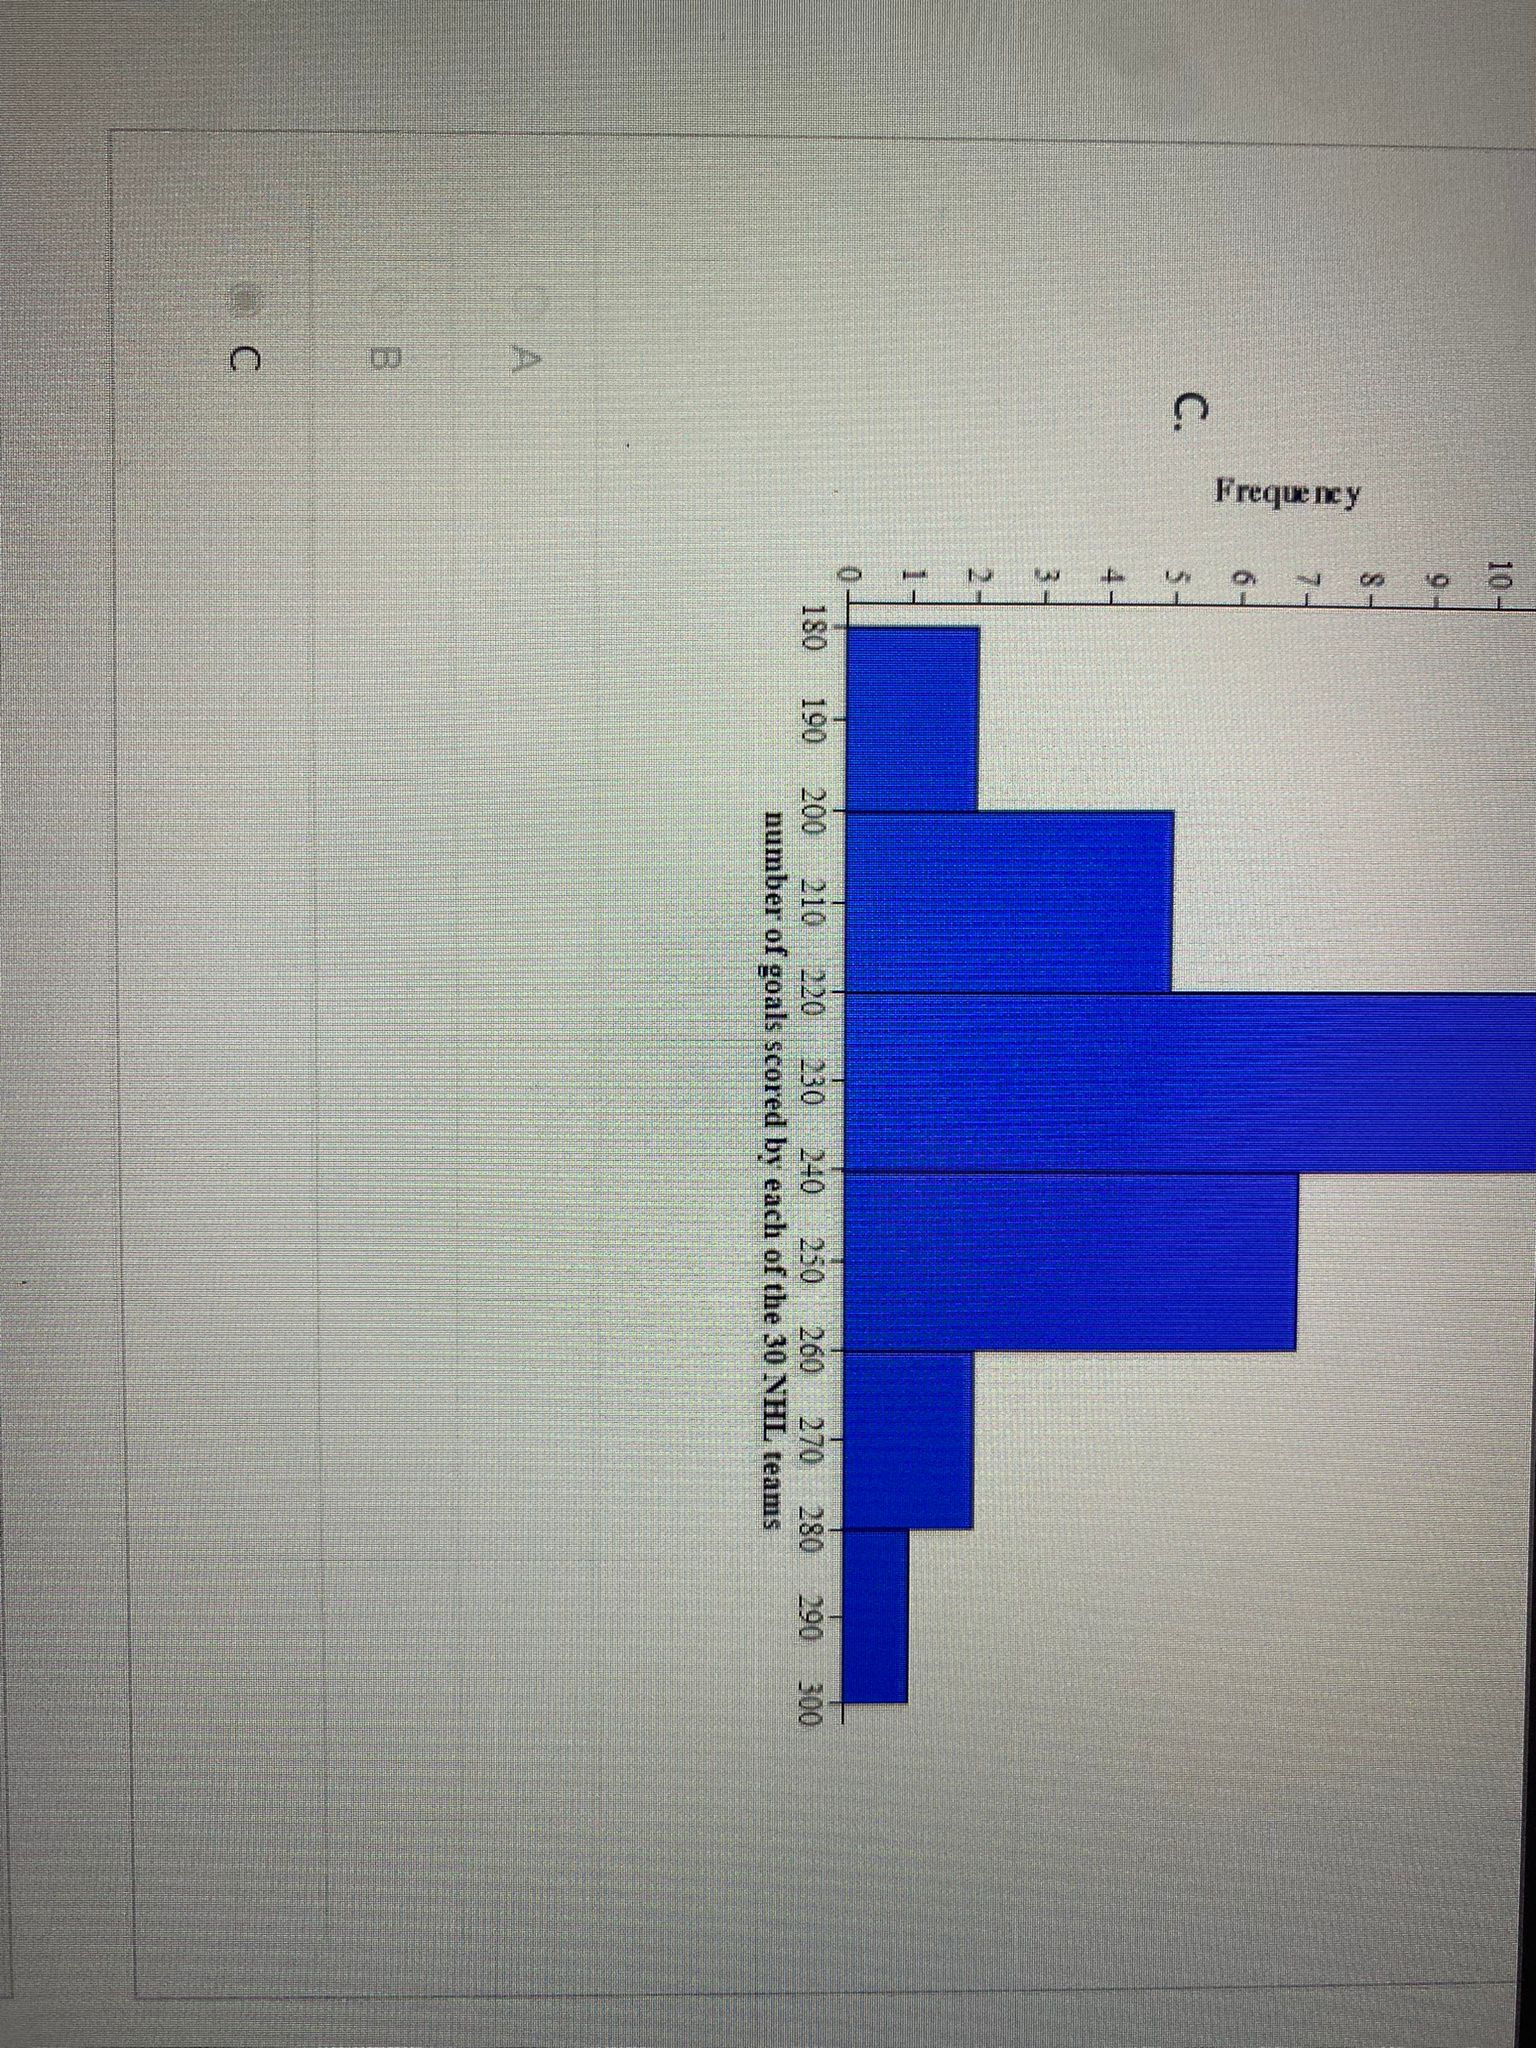
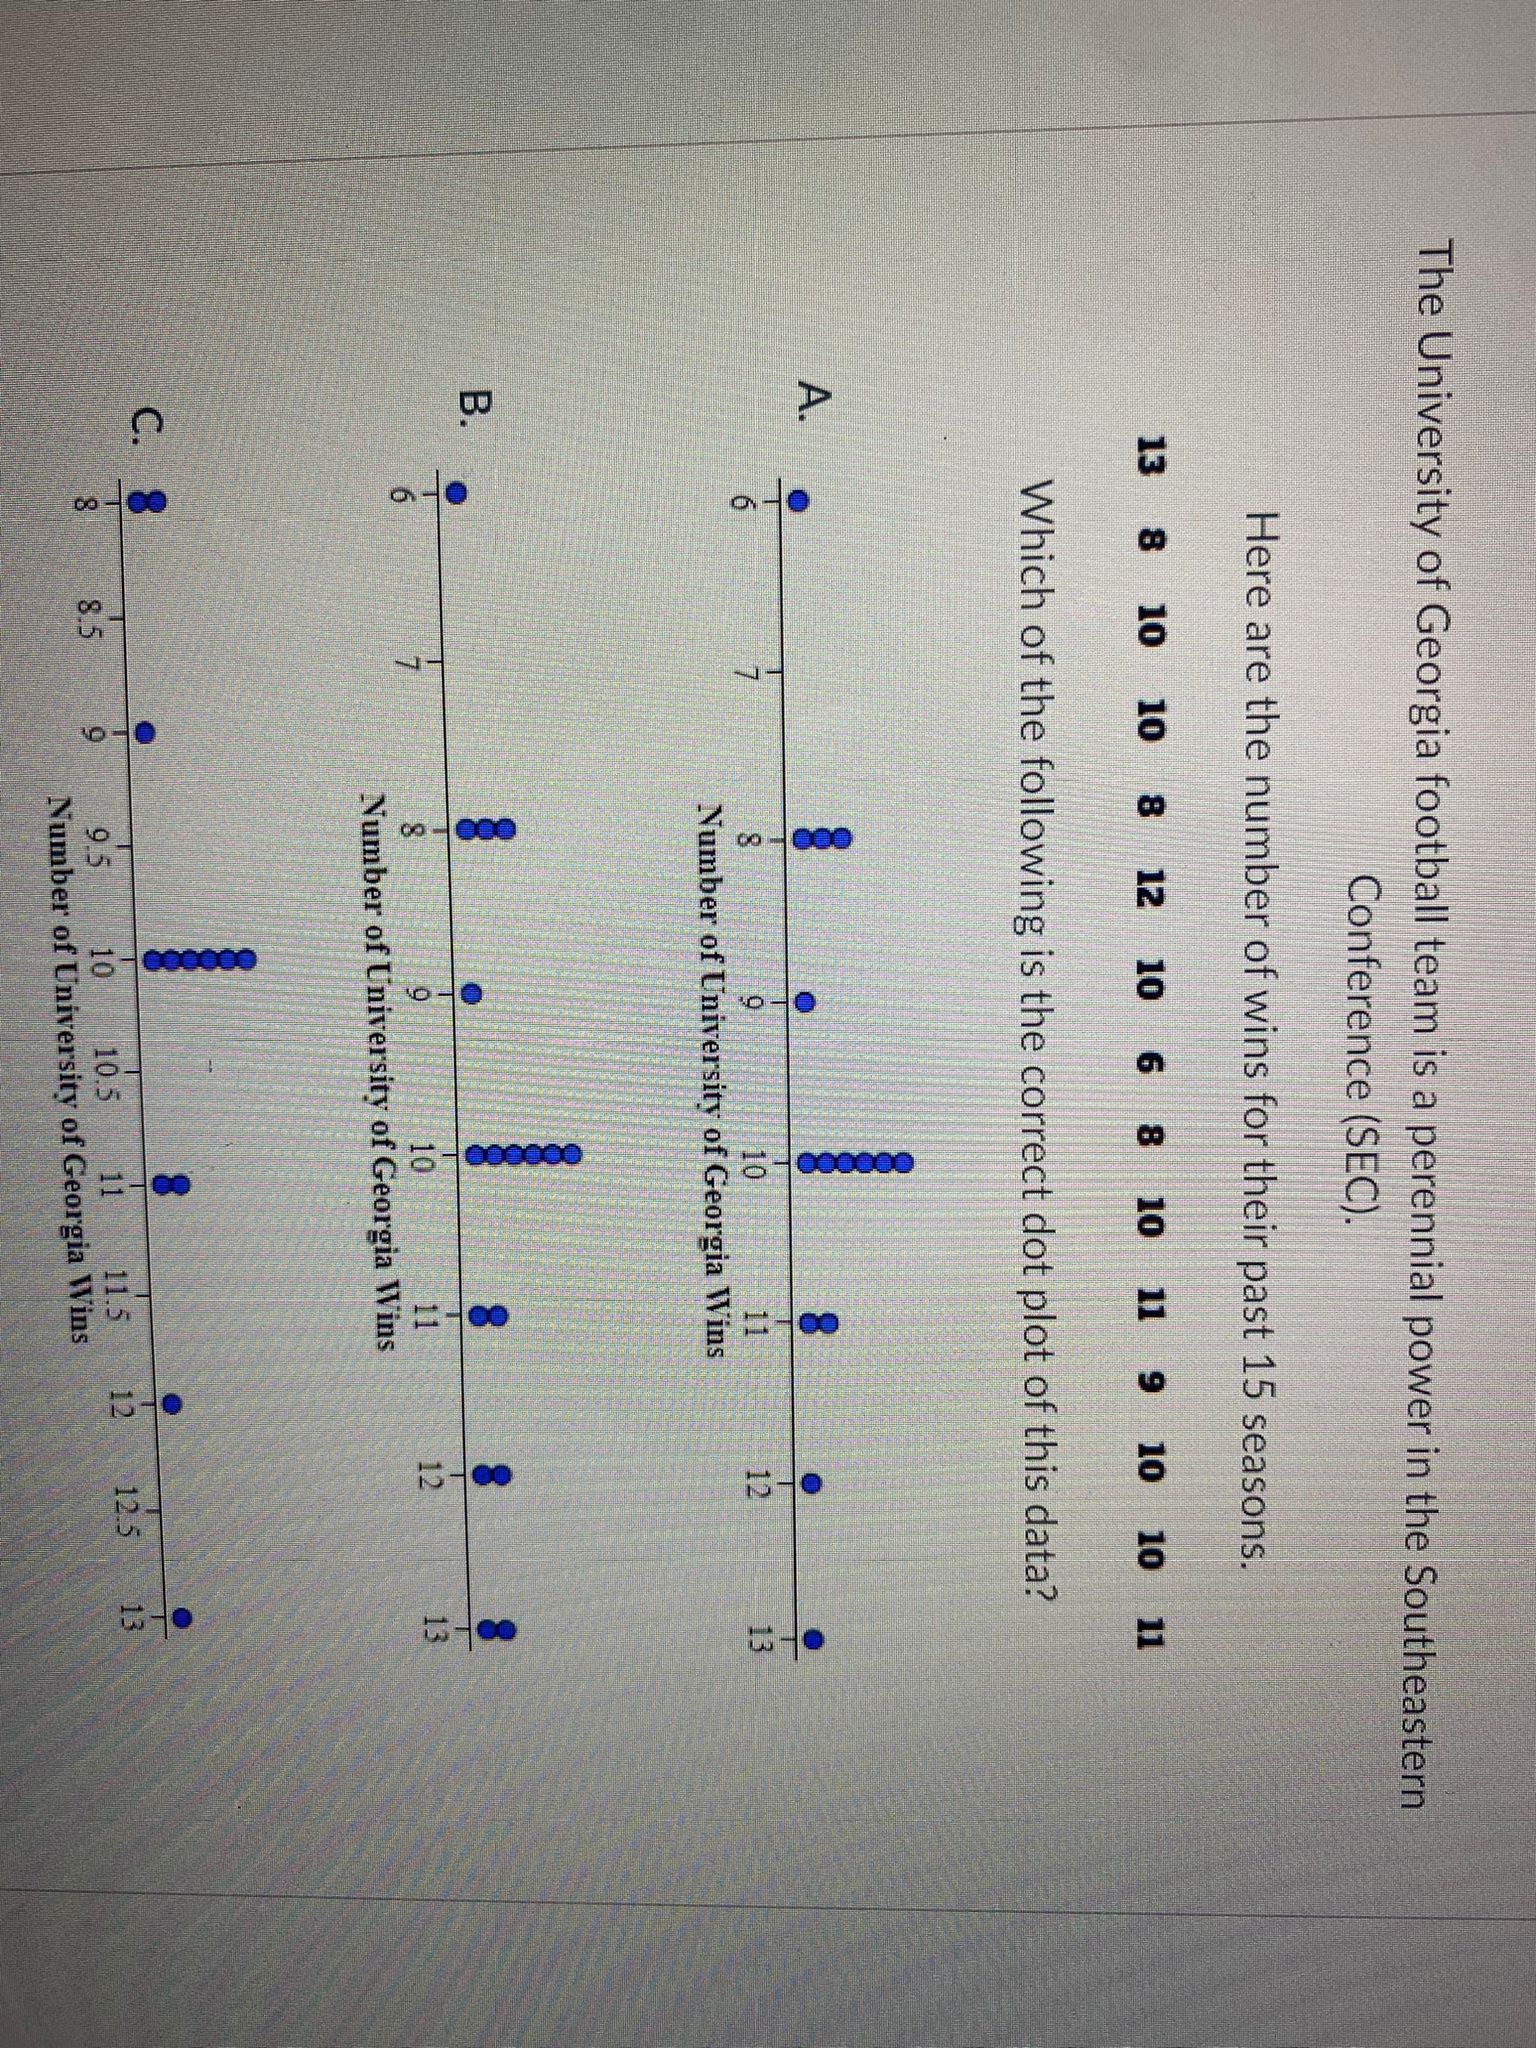
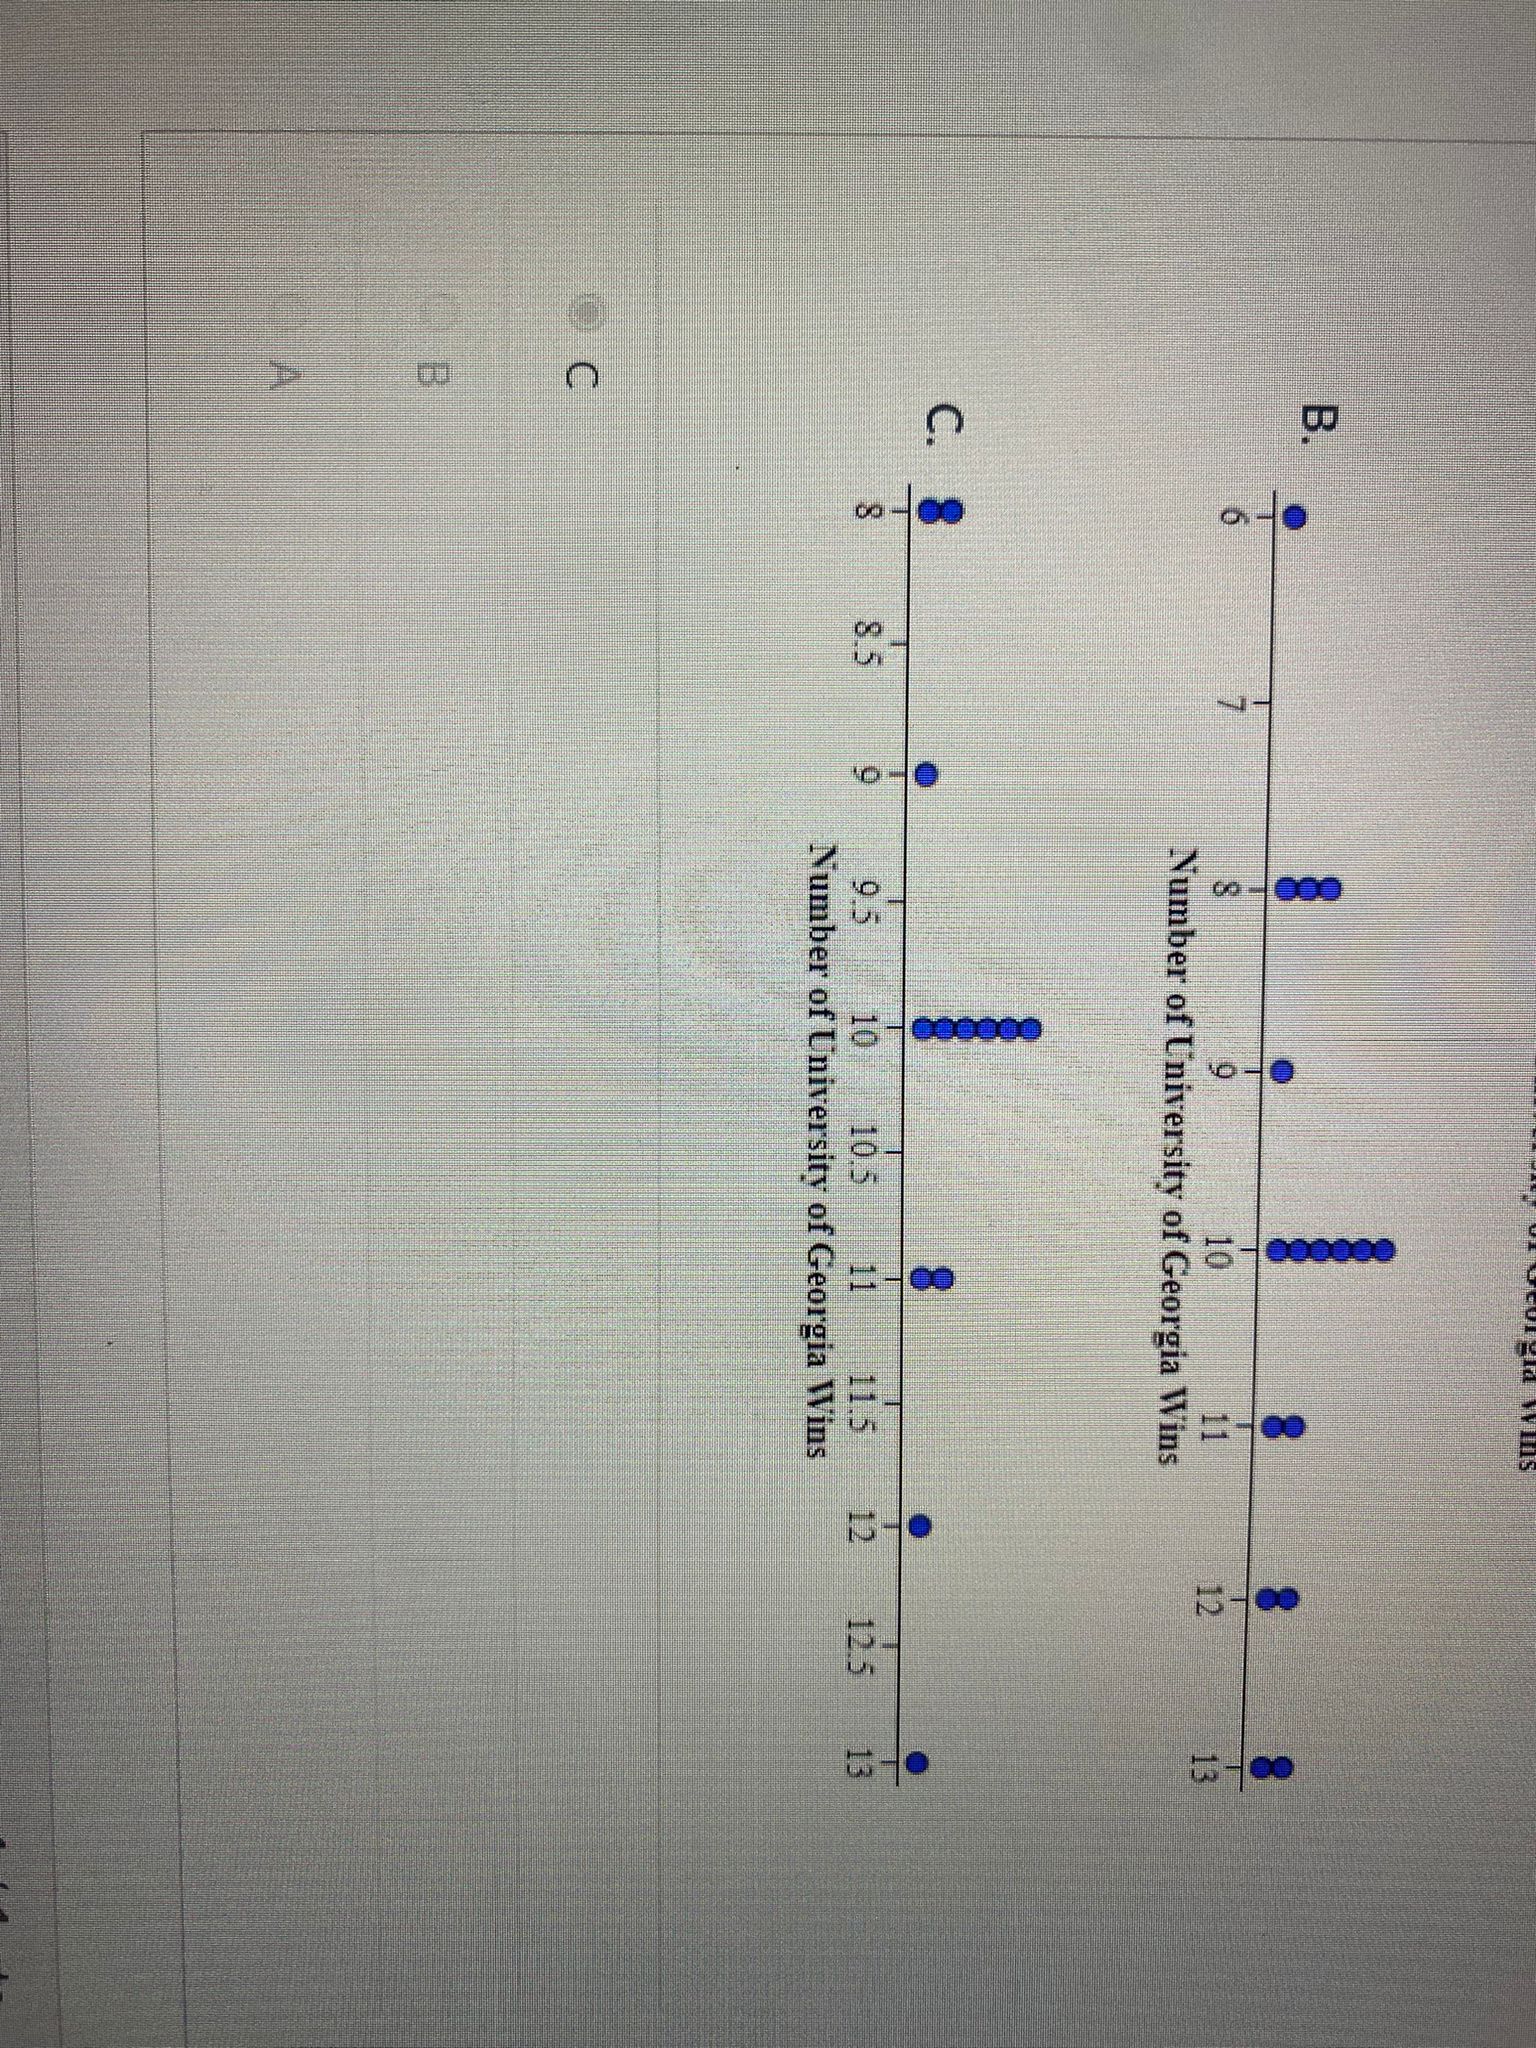
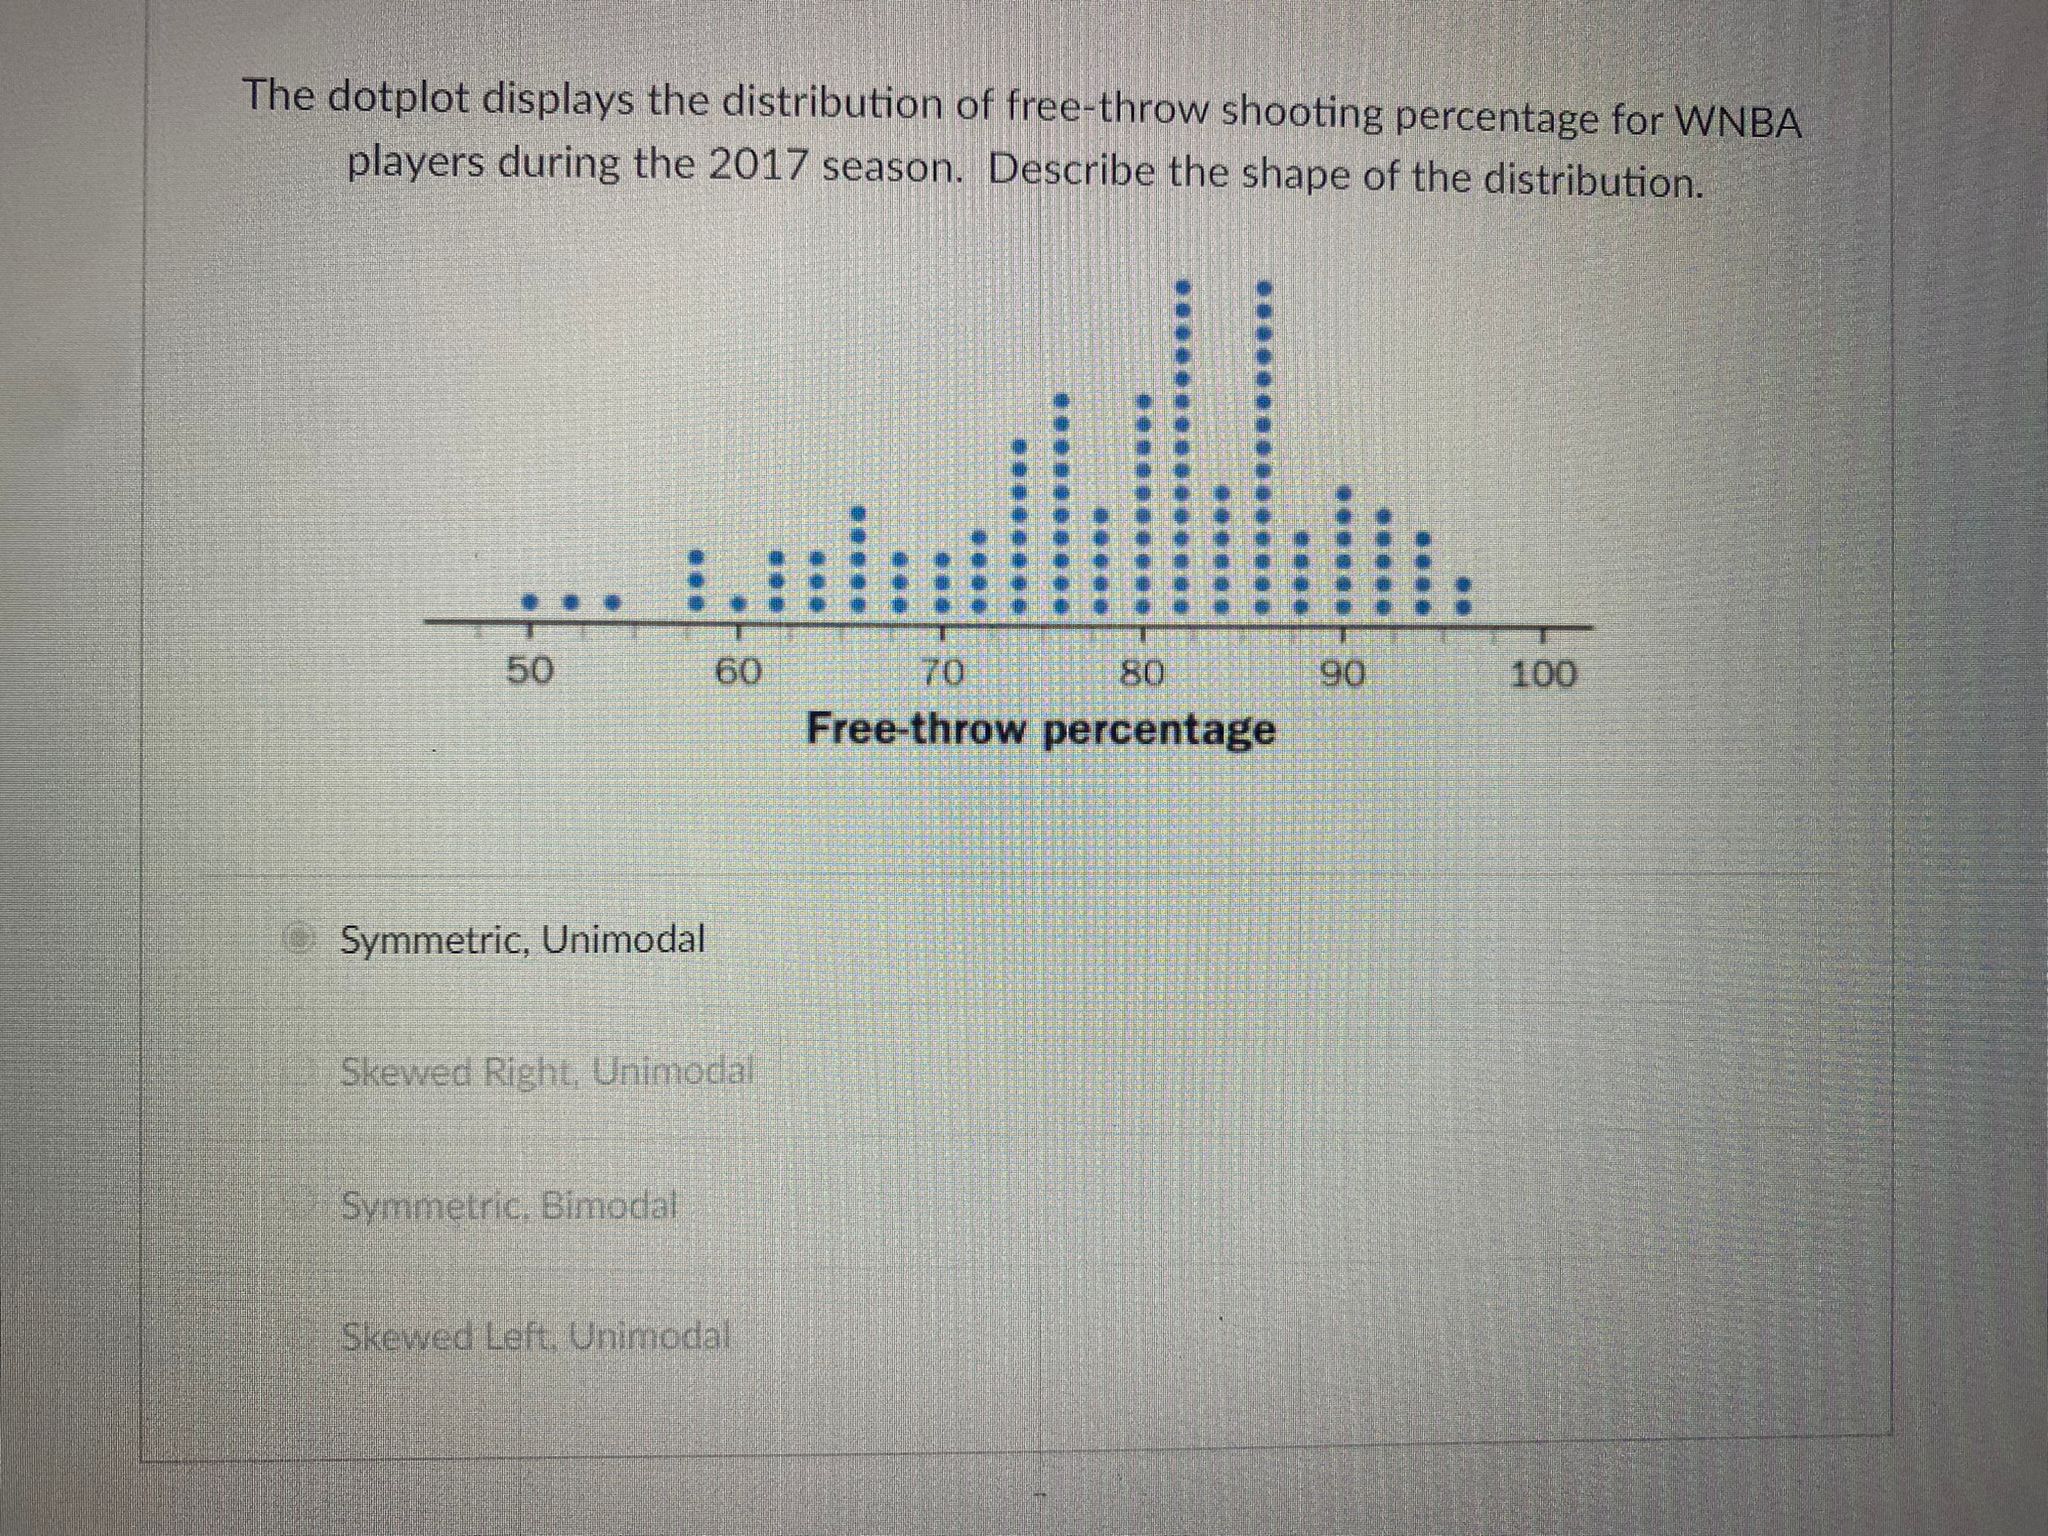
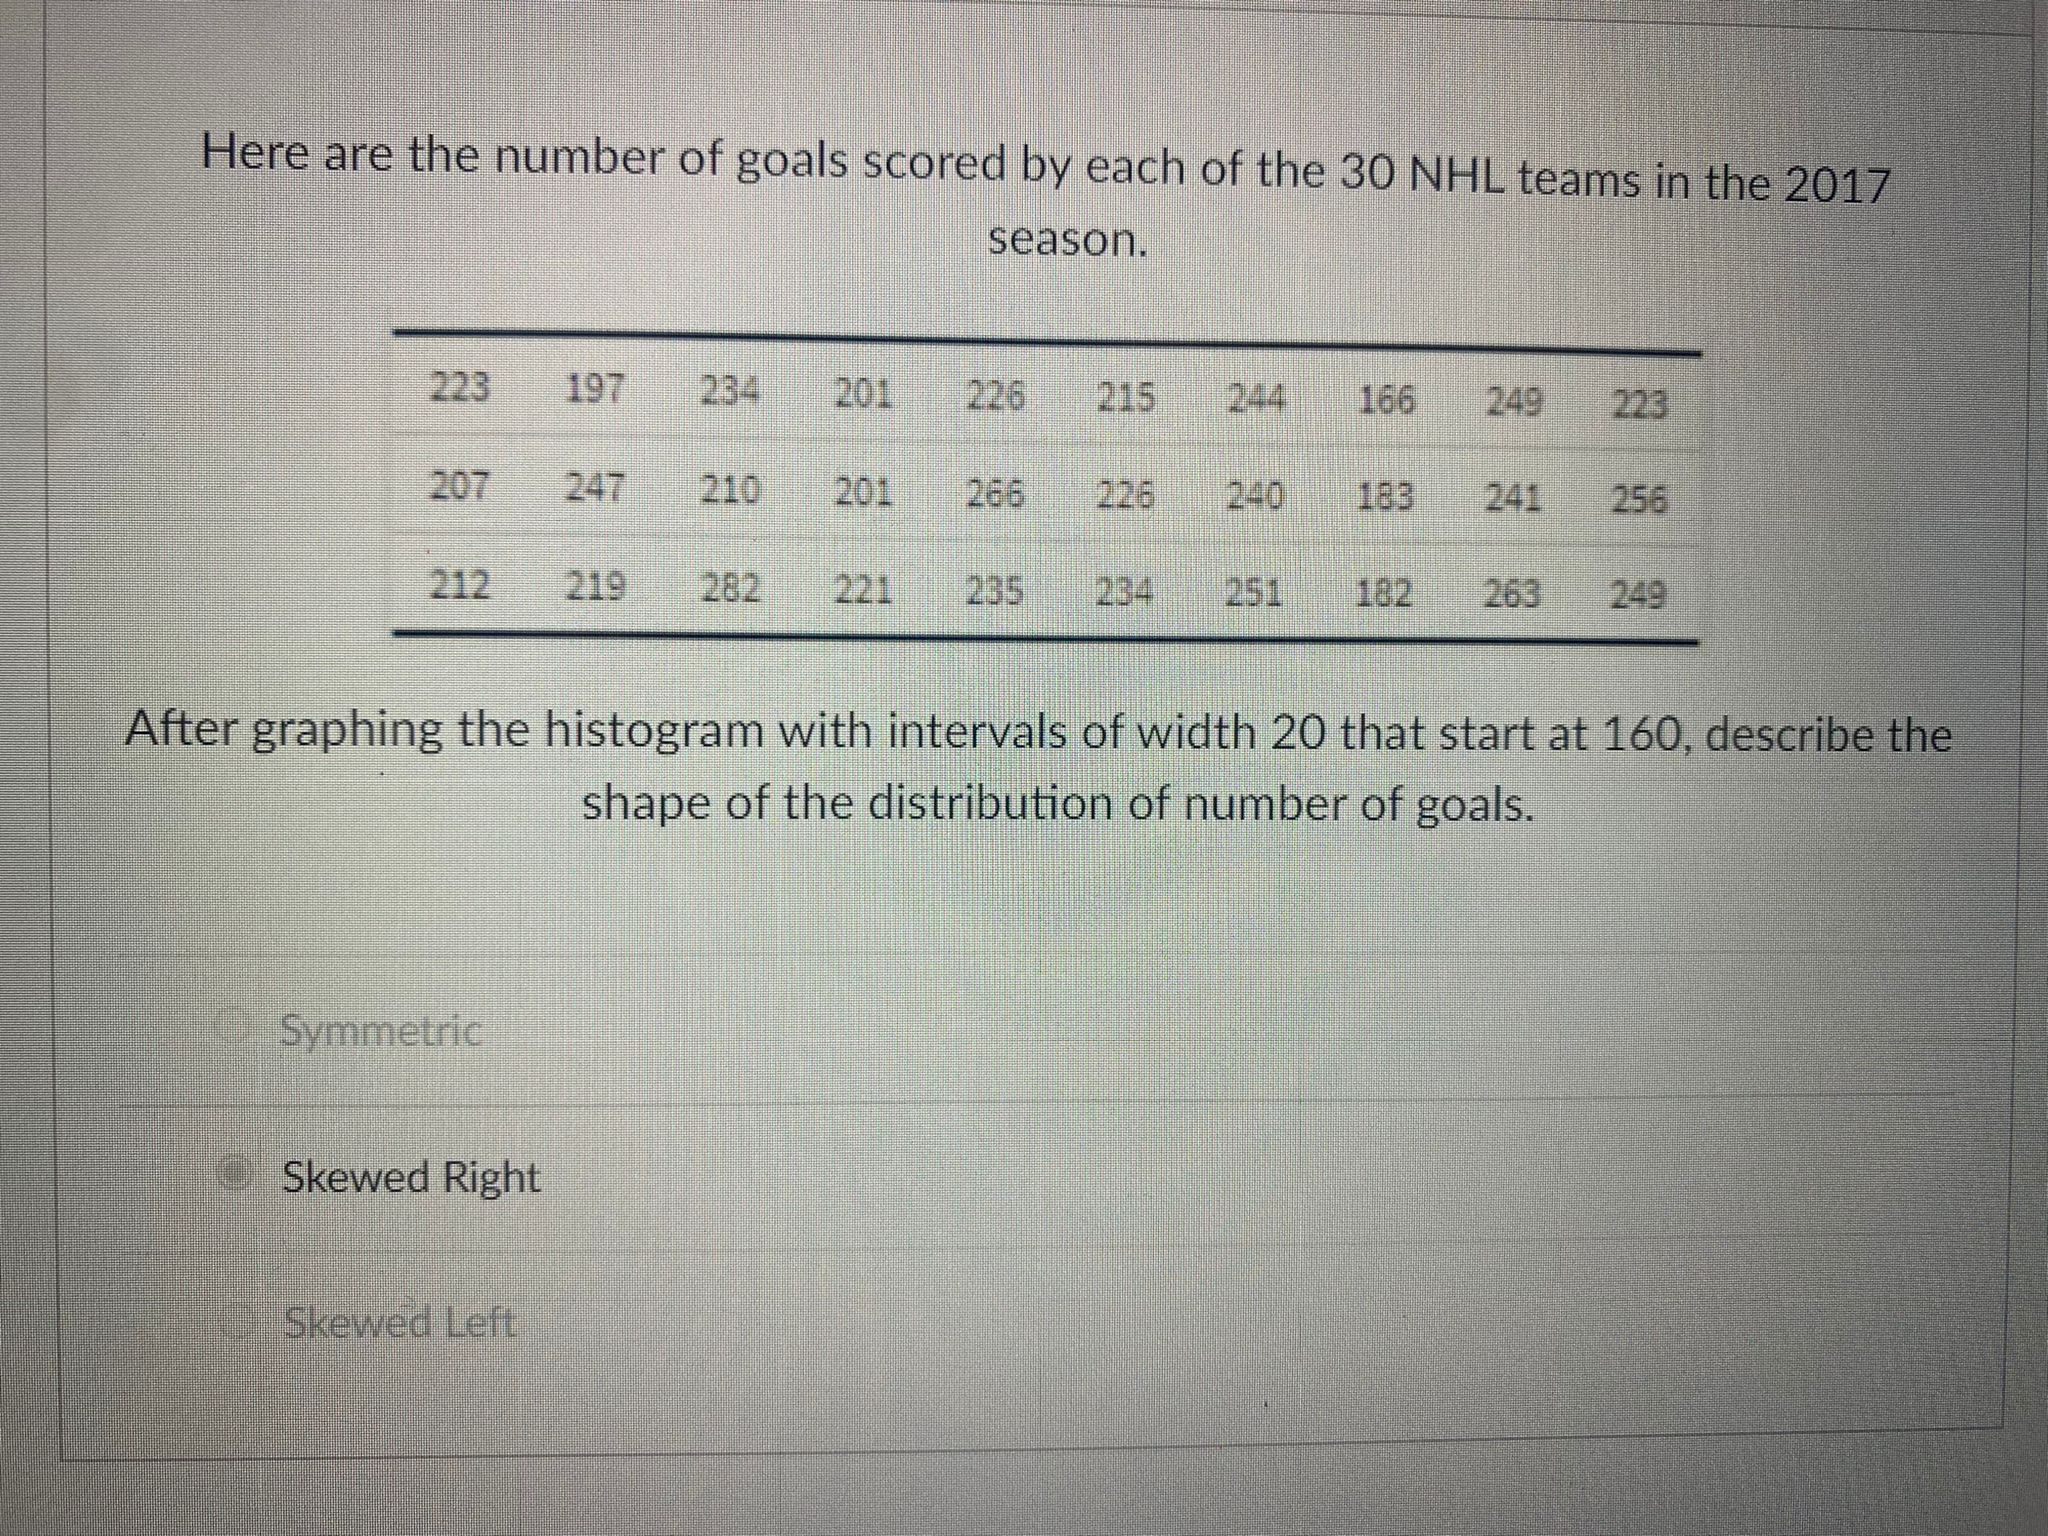
The dotplot displays the distribution of height for WNBA players during the 2017 season. Describe the shape of the distribution. 64 66 68 70 72 74 76 78 80 82 Height (in.) Symmetric, Bimodal Symmetric, Unimodal Skewed Left, Bimodal Skewed Right, BimodalThe University of Georgia football team is a perennial power in the Southeastern Conference (SEC). Here are the number of wins for their past 15 seasons. 13 8 10 10 8 12 10 6 8 10 11 9 10 10 11 Describe the shape of the distribution. Frequency ST Number of University of Georgia WinsThe University of Georgia football team is a perennial power in the Southeastern Conference (SEC). Here are the number of wins for their past 15 seasons. 13 8 10 10 8 12 10 6 8 10 11 9 10 10 11 Describe the shape of the distribution. in Frequency S+ -00 10 11 12 Number of University of Georgia Wins Bimodal Symmetric Skewed RightHere are the number of goals scored by each of the 30 NHL teams in the 2017 season. 223 197 234 201 226 215 244 166 249 207 247 210 201 266 226 240 183 241 256 212 219 282 221 235 234 251 182 263 249 Which of the following histograms displays the distribution of number of goals scored. Use intervals of width 20 that start at 160. Frequency + 200 280 300 160 180 240 260 number of goals scored by each of the 30 NHL teamsin Frequency + on 160 180 240 260 280 300 number of goals scored by each of the 30 NHL teams Frequency 180 190 200 210 220 230 240 250 260 270 280 290 300 number of goals scored by each of the 30 NHL teamsFrequency 00 067 087 047 097 057 OFZ OEC 072 017 007 061 081 number of goals scored by each of the 30 NHL teamsThe University of Georgia football team is a perennial power in the Southeastern Conference (SEC). Here are the number of wins for their past 15 seasons. 13 8 10 10 8 12 10 6 8 10 11 9 10 10 11 Which of the following is the correct dot plot of this data? Number of University of Georgia Wins Number of University of Georgia Wins U - O in 10 10.5 11 11.5 12 125 Number of University of Georgia WinsNumber of University of Georgia Wins .m 10 10.5 11 11.5 Number of University of Georgia Wins U mThe dotplot displays the distribution of free-throw shooting percentage for WNBA players during the 2017 season. Describe the shape of the distribution. . . . : . 50 60 70 80 90 100 Free-throw percentage Symmetric, Unimodal Skewed Right, Unimodal Symmetric. Bimodal Skewed Left. UnimodalHere are the number of goals scored by each of the 30 NHL teams in the 2017 season. 223 197 234 201 226 215 244 166 249 223 207 247 210 201 266 226 240 183 241 256 212 219 282 221 235 234 251 182 263 249 After graphing the histogram with intervals of width 20 that start at 160, describe the shape of the distribution of number of goals. Symmetric Skewed Right Skewed Left
Step by Step Solution
There are 3 Steps involved in it

Get step-by-step solutions from verified subject matter experts