

Question: The drop down choices for the first one are : leather jackets, smartphones . The drop down choices for the second one are : less,
The drop down choices for the first one are : leather jackets, smartphones . The drop down choices for the second one are : less, more

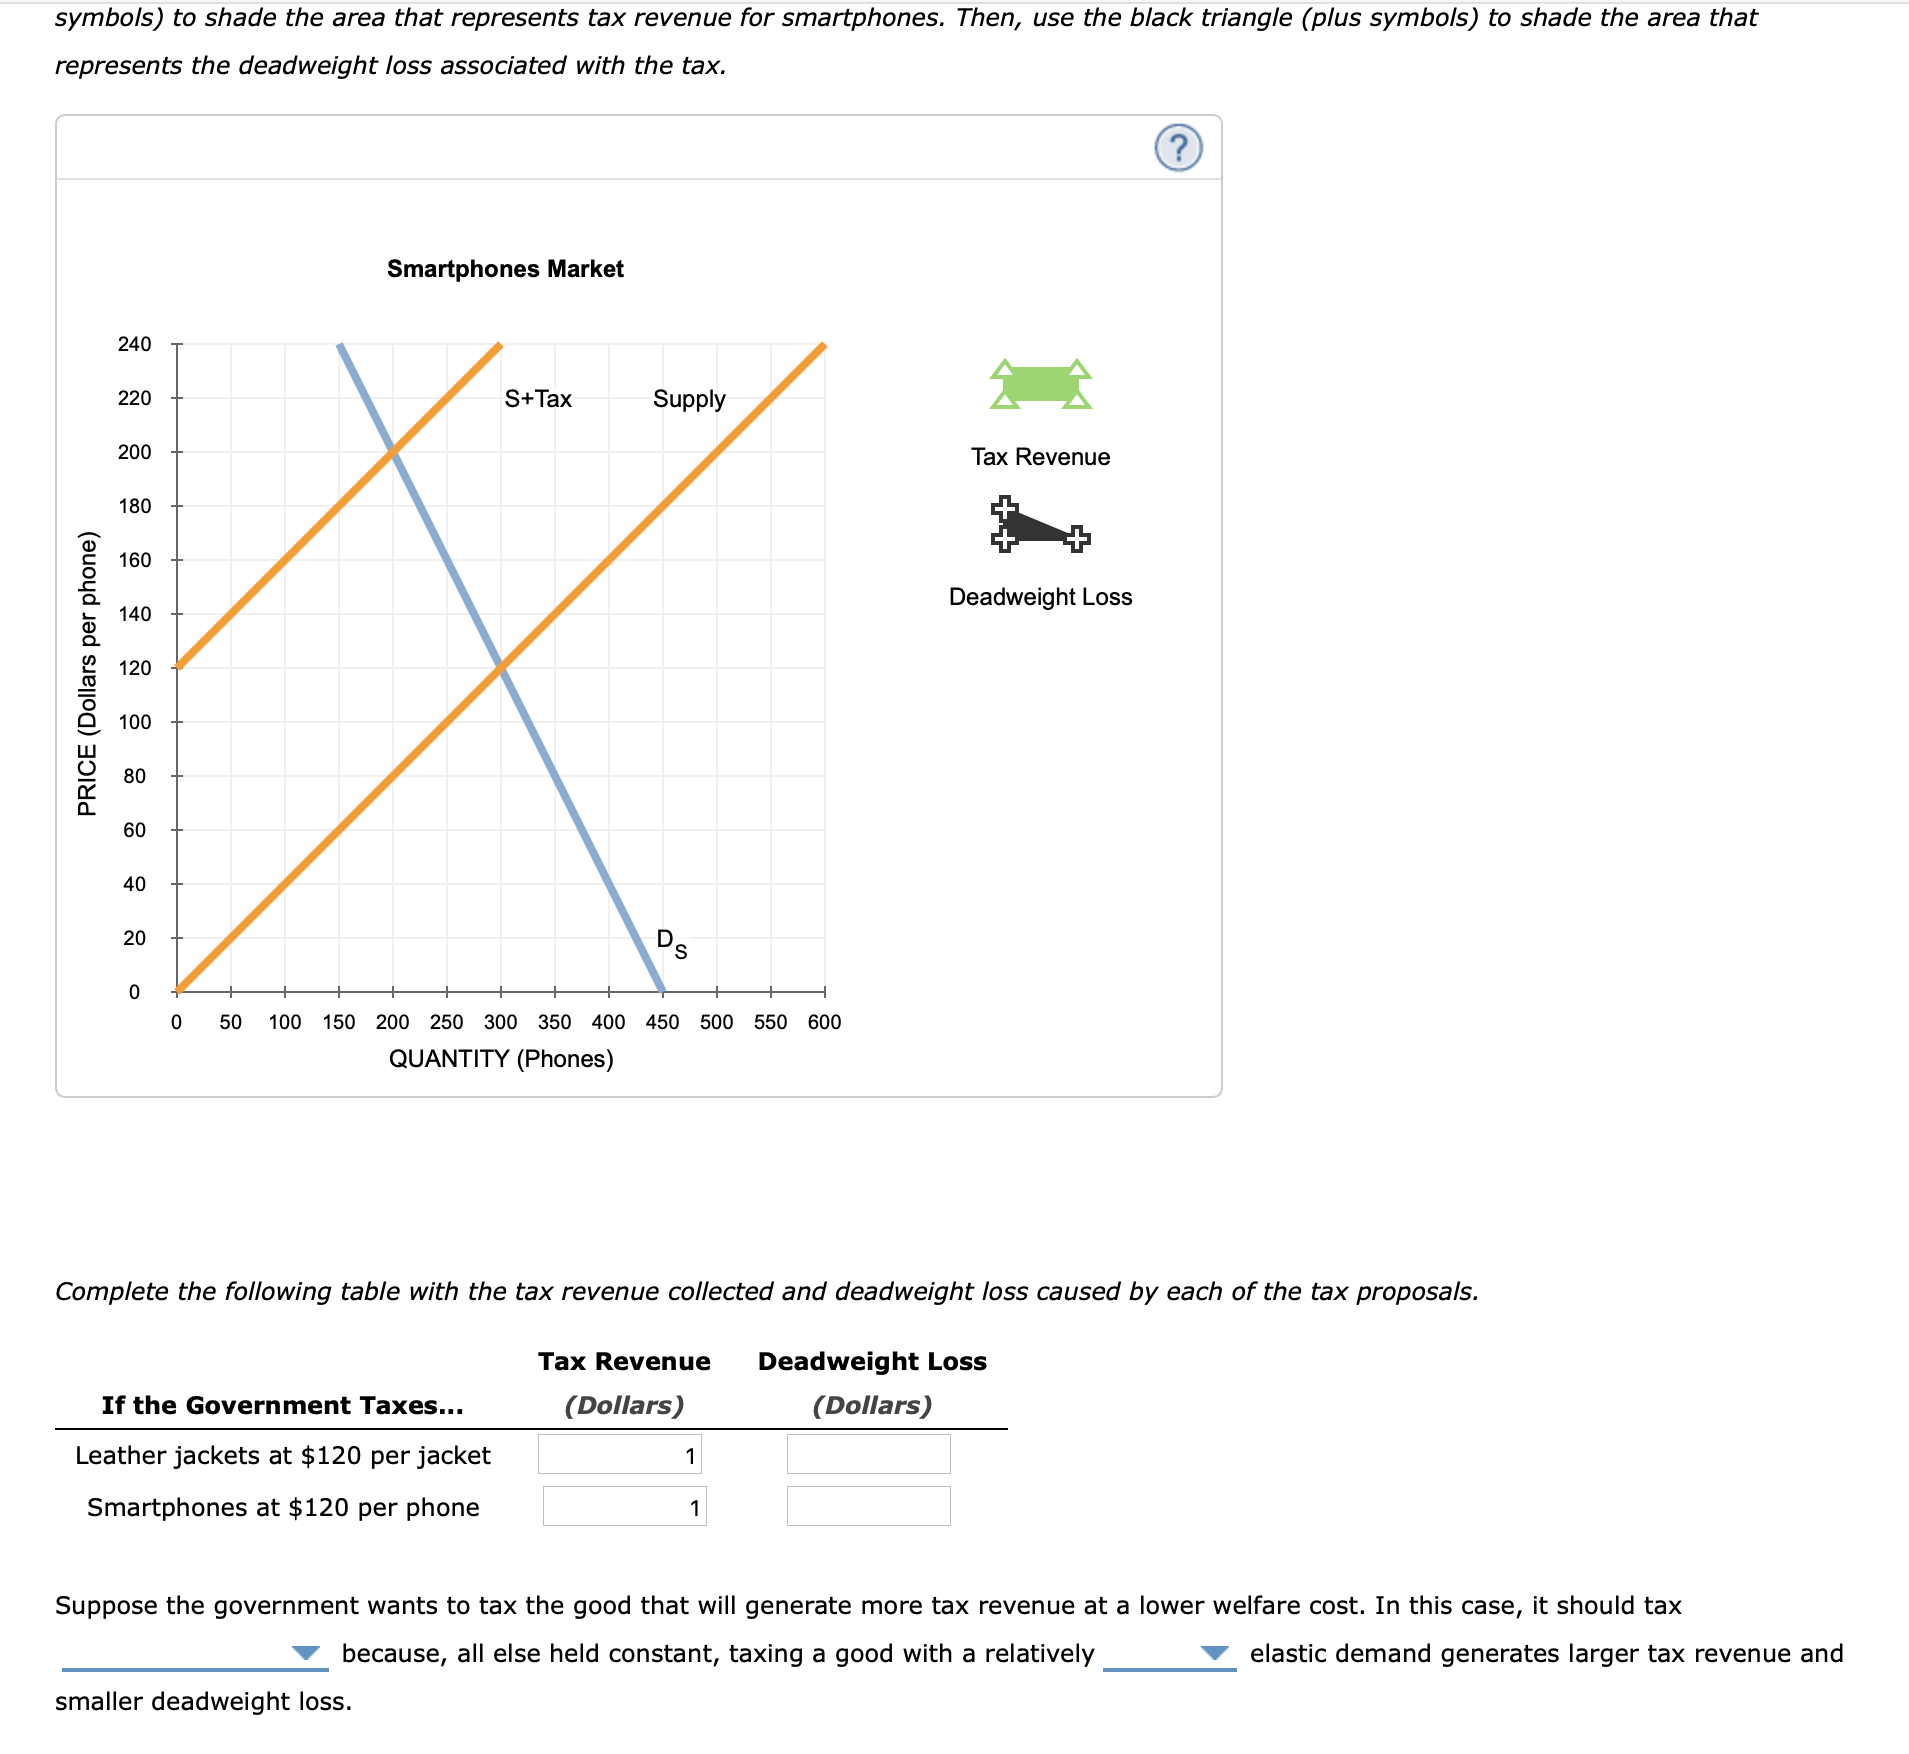
3. Relationship between tax revenues, deadweight loss, and demand elasticity The government is considering levying a tax of $120 per unit on suppliers of either leatherjackets or smartphones. The supply curve for each of these two goods is identical, as you can see on each of the following graphs. The demand for leather jackets is shown by D); (on the first graph), and the demand for smartphones is shown by D; (on the second graph). Suppose the government taxes leather jackets. The following graph shows the annual supply and demand for this good. It also shows the supply curve ( S + Tax) shifted up by the amount of the proposed tax ($120 per jacket). On the following graph, use the green rectangle ( triangle symbols) to shade the area that represents tax revenue for leather jackets. Then use the black triangle (plus symbols) to shade the area that represents the deadweight loss associated with the tax. Leather Jackets Market 240 H 220 200 Tax Revenue 180 2 g 160 1!. D w i ht Lo 5 140 ead eg 55 D. E 120 _o 9 100 \"3 E 30 n. so 40 20 o o 50 100 150 200 250 300 350 400 450 500 550 600 QUANTITY (Jackets) Instead, suppose the government taxes smartphones. The following graph shows the annual supply and demand for this good, as well as the supply curve shifted up by the amount of the proposed tax ($120 per phone). 0n the following graph, do for smartphones the same thing you did previously on the graph for leather jackets. Use the green rectangle (triangle symbols) to shade the area that represents tax revenue for smartphones. Then, use the black triangle (plus symbols) to shade the area that represents the deadweight loss associated with the tax. symbols) to shade the area that represents tax revenue for smartphones. Then, use the black triangle (plus symbols) to shade the area that represents the deadweight loss associated with the tax. 6') Smartphones Market 240 H 220 200 Tax Revenue 130 3 11? E 160 Q Deadweig ht Loss g 140 1: D. 10 E 120 T: g 100 m 9 so n: B. so 40 20 O l I l l I l I l l I 0 50 100 150 200 250 300 350 400 450 500 550 600 QUANTITY (Phones) Complete the following table with the tax revenue collected and deadweight loss caused by each of the tax proposals. Tax Revenue Deadweight Loss If the Government Taxes... (Dollars) (Dollars) Leather jackets at $120 per jacket 1 Smartphones at $120 per phone 1 Suppose the government wants to tax the good that will generate more tax revenue at a lower welfare cost. In this case, it should tax v because, all else held constant, taxing a good with a relatively v elastic demand generates larger tax revenue and smaller deadweight loss
Step by Step Solution
There are 3 Steps involved in it

Get step-by-step solutions from verified subject matter experts