

Question: The dynamic figure shows a movable vertical line and five different graphs. Graph A is the graph of the equation |y|=x. Graph B is a
The dynamic figure shows a movable vertical line and five different graphs. Graph A is the graph of the equation |y|=x. Graph B is a graph of the points (- 5, 9) , (- 0.5, 2)(1, - 5) (1,2), (2, 2), and (7, 4) Graph C is a graph of the equation y = 7 ln(- x) Graph D is a graph of a smiley face, and Graph E is a graph of the equation y = 4sin(x). Drag the point labeled " Vertical line" to move the line and explore the number of intersections of the vertical lines and each graph. Then determine whether each graph represents a function of x.Which of the graphs in the dynamic figure represent functions of x? A. Graph A, Graph B, and Graph D B. Graph A and Graph D C. Graph C and Graph E D. Graph B, Graph C, and Graph E
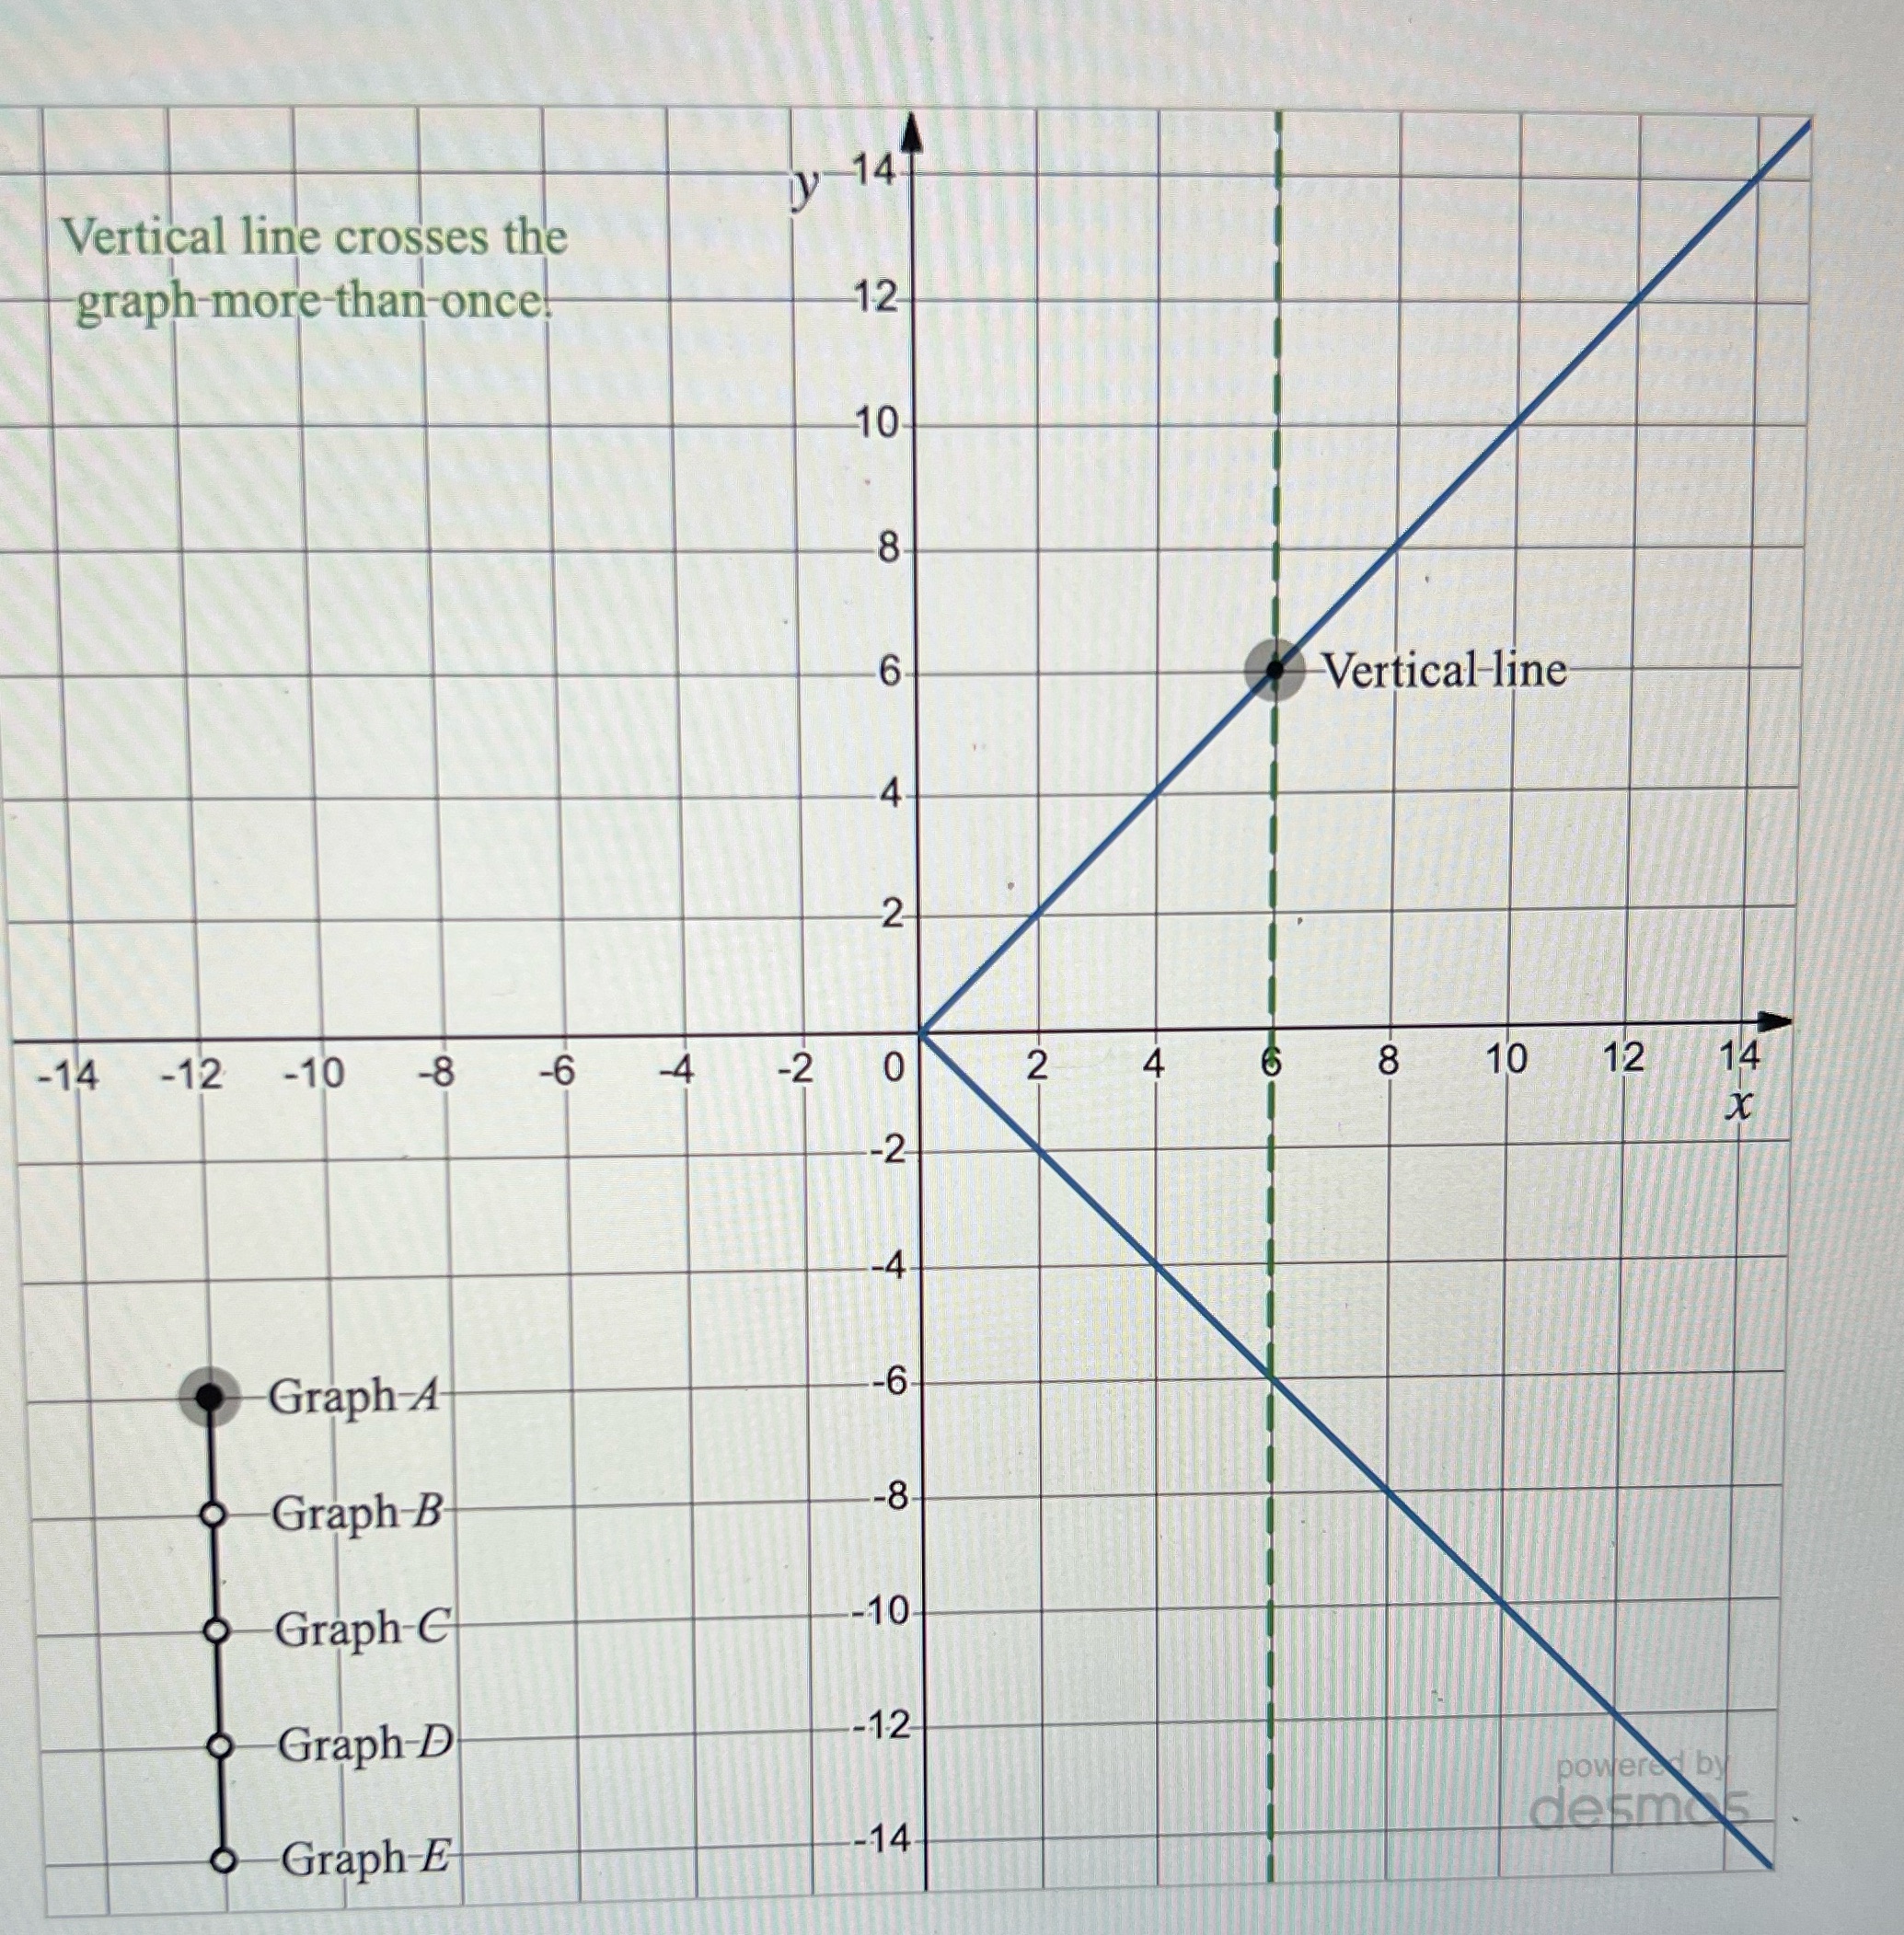
iV 14 Vertical line crosses the graph-more than-once 12 10 -8 -6 Vertical-line 4 -2- -14 -12 -10 -8 -6 -4 -2 0 2 4 6 8 10 12 14 -2 X -4 Graph-A -6 Graph-B- -8 -Graph-C 10 -Graph-D 12 power by -Graph-E 14 desma
Step by Step Solution
There are 3 Steps involved in it

Get step-by-step solutions from verified subject matter experts