

Question: The electrical engineer has given the data regarding overloading of resistors of in a computer system and the failure times given below: table [
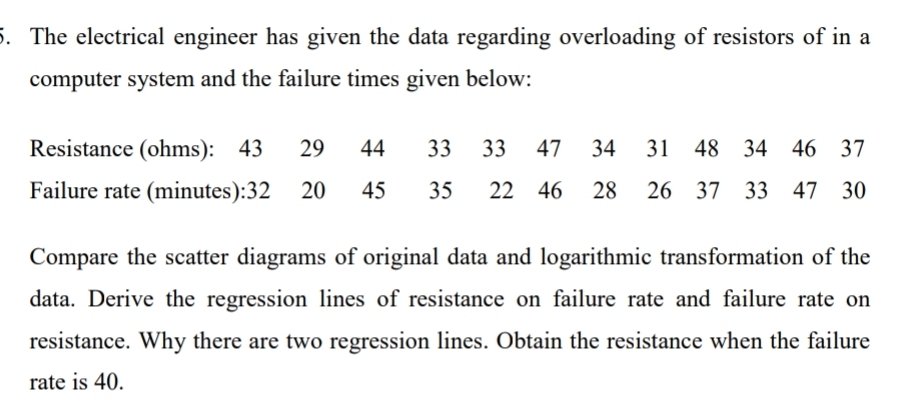
The electrical engineer has given the data regarding overloading of resistors of in a computer system and the failure times given below:
tableResistance ohms:Failure rate minutes:
Compare the scatter diagrams of original data and logarithmic transformation of the data. Derive the regression lines of resistance on failure rate and failure rate on resistance. Why there are two regression lines. Obtain the resistance when the failure rate is
Step by Step Solution
There are 3 Steps involved in it
1 Expert Approved Answer
Step: 1 Unlock

Question Has Been Solved by an Expert!
Get step-by-step solutions from verified subject matter experts
Step: 2 Unlock
Step: 3 Unlock