

Question: The Energy vs Time graph below refers to a block sliding down an inclined plane. Energy vs. Time Time (s) CDLB A a. The
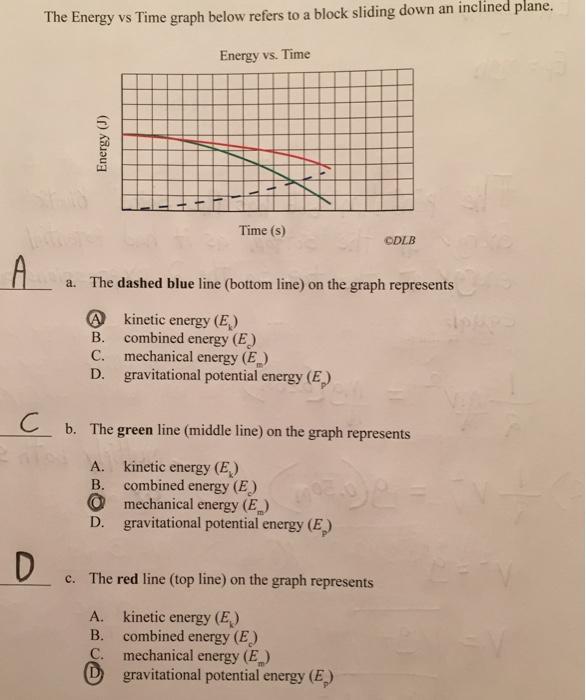
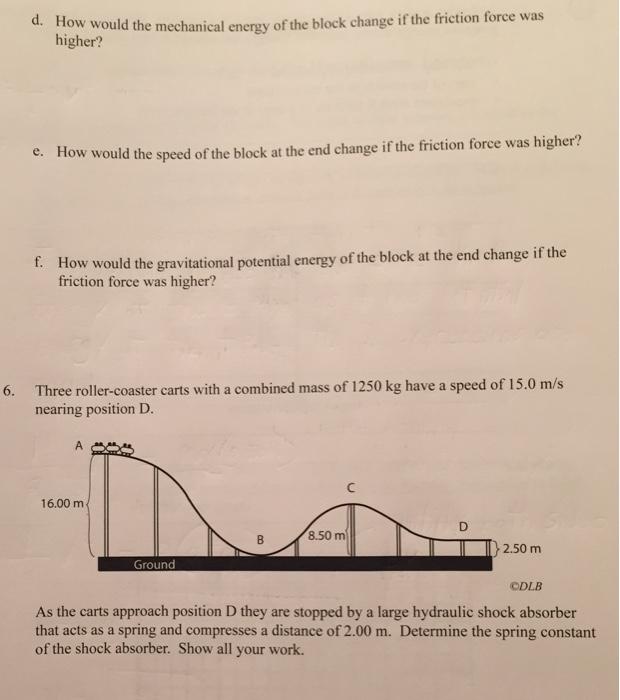
The Energy vs Time graph below refers to a block sliding down an inclined plane. Energy vs. Time Time (s) CDLB A a. The dashed blue line (bottom line) on the graph represents A kinetic energy (E) B. combined energy (E) mechanical energy (E_) D. gravitational potential energy (E) . C C b. The green line (middle line) on the graph represents kinetic energy (E) combined energy (E) O mechanical energy (E) D. gravitational potential energy (E) . . c. The red line (top line) on the graph represents kinetic energy (E) combined energy (E) C. mechanical energy (E_) D gravitational potential energy (E) . . Energy (J) d. How would the mechanical energy of the block change if the friction force was higher? e. How would the speed of the block at the end change if the friction force was higher? f. How would the gravitational potential energy of the block at the end change if the friction force was higher? 6. Three roller-coaster carts with a combined mass of 1250 kg have a speed of 15.0 m/s nearing position D. A 16.00 m 8.50 m 2.50 m Ground ODLB As the carts approach position D they are stopped by a large hydraulic shock absorber that acts as a spring and compresses a distance of 2.00 m. Determine the spring constant of the shock absorber. Show all your work.
Step by Step Solution
3.45 Rating (148 Votes )
There are 3 Steps involved in it
a Kinetic energy as the velocity is increasing b Green line represents GPE cCombined energy d mechan... View full answer

Get step-by-step solutions from verified subject matter experts