

Question: The entire question with the data from the spreadsheet are below. vity 1 - Hypothesis Test for Significance in Multiple Regression with XLMiner Analysis ToolPak
The entire question with the data from the spreadsheet are below.
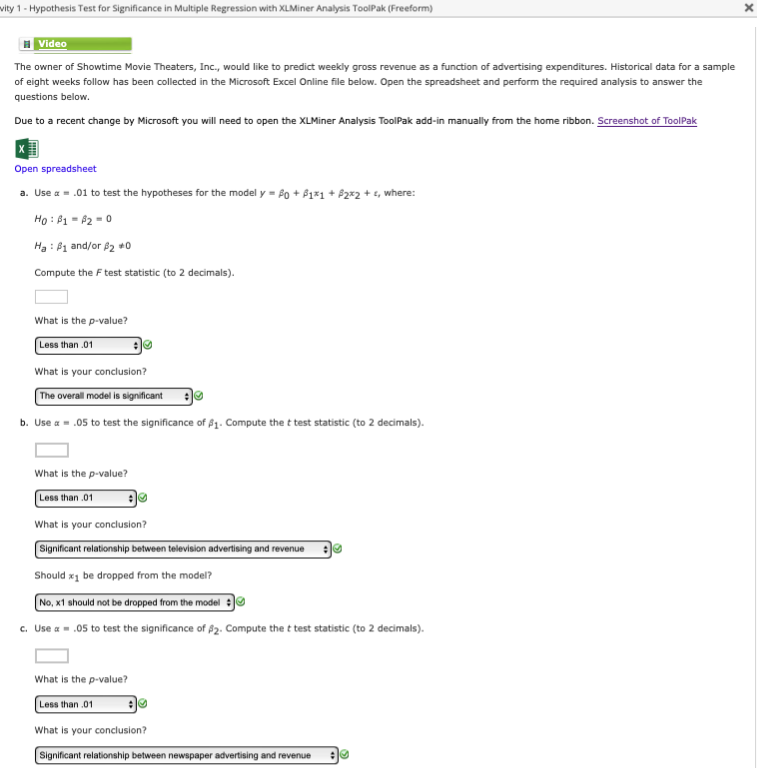
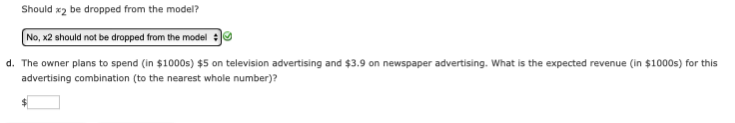
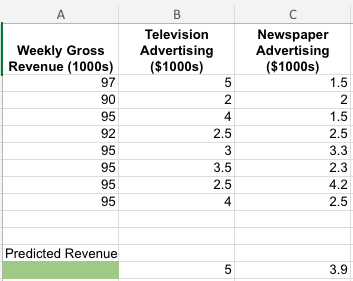
vity 1 - Hypothesis Test for Significance in Multiple Regression with XLMiner Analysis ToolPak (Freeform) H Video The owner of Showtime Movie Theaters, Inc., would like to predict weekly gross revenue as a function of advertising expenditures. Historical data for a sample of eight weeks follow has been collected in the Microsoft Excel Online file below. Open the spreadsheet and perform the required analysis to answer the questions below. Due to a recent change by Microsoft you will need to open the XLMiner Analysis ToolPak add-in manually from the home ribbon. Screenshot of ToolPak Open spreadsheet a. Use a = .01 to test the hypotheses for the model y = Fo + #1x, + #2x2 + r, where: Ho : $1 = #2 = 0 Ha : $1 and/or #2 #0 Compute the F test statistic (to 2 decimals). What is the p-value? Less than .01 What is your conclusion? The overall model is significant b. Use a = .05 to test the significance of #1- Compute the t test statistic (to 2 decimals). What is the p-value? Less than .01 What is your conclusion? Significant relationship between television advertising and revenue Should x1 be dropped from the model? No, x1 should not be dropped from the model :@ c. Use a = .05 to test the significance of #2. Compute the t test statistic (to 2 decimals). What is the p-value? Less than .01 What is your conclusion? Significant relationship between newspaper advertising and revenue :eShould x2 be dropped from the model? No, x2 should not be dropped from the model # d. The owner plans to spend (in $1000s) $5 on television advertising and $3.9 on newspaper advertising. What is the expected revenue (in $1000s) for this advertising combination (to the nearest whole number)?\f
Step by Step Solution
There are 3 Steps involved in it

Get step-by-step solutions from verified subject matter experts