

Question: The equation below represents a linear demand curve. Use the grid (right) for your plots. Write all derivations in the space below. 1) Plot the
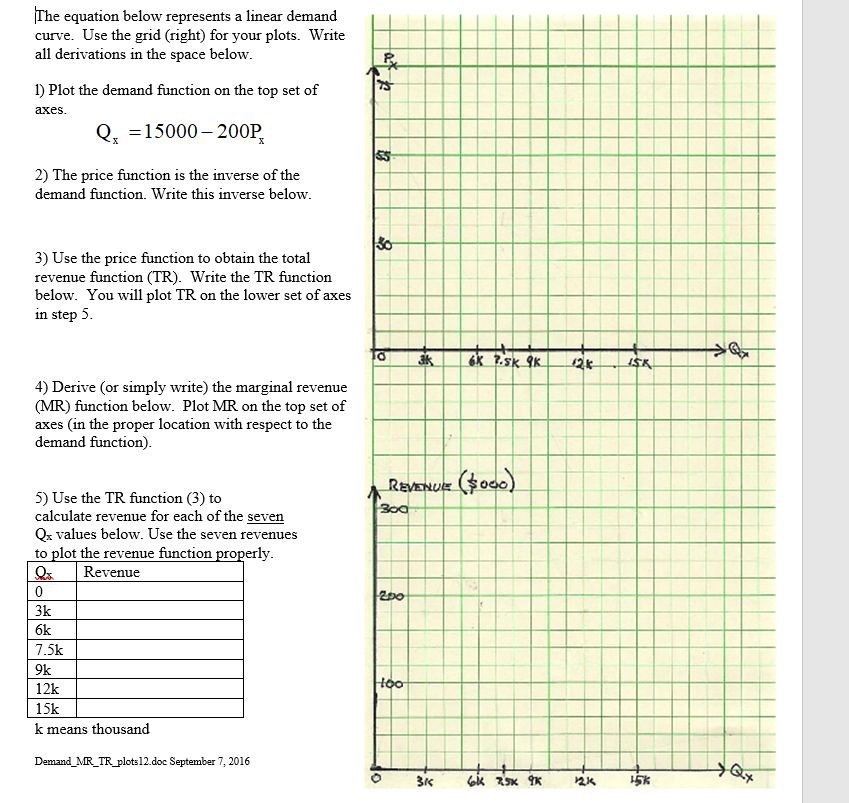
The equation below represents a linear demand curve. Use the grid (right) for your plots. Write all derivations in the space below. 1) Plot the demand function on the top set of axes . Qx =15000 -200P 55 2) The price function is the inverse of the demand function. Write this inverse below. 3) Use the price function to obtain the total 30 revenue function (TR). Write the TR function below. You will plot TR on the lower set of axes in step 3. 3k OK 2.5K 9K 12 K 15K 4) Derive (or simply write) the marginal revenue MR) function below. Plot MR on the top set of axes (in the proper location with respect to the demand function). 5) Use the TR function (3) to REVENUE ($060 ) calculate revenue for each of the seven 300 Q values below. Use the seven revenues to plot the revenue function properly. Revenue 0 200 3k 6k 7.5k 9k 12k Hoo 15k k means thousand Demand_MR._TR._plots12 doc September 7, 2016 31 6/ ASK 9K 121 15K
Step by Step Solution
There are 3 Steps involved in it

Get step-by-step solutions from verified subject matter experts