

Question: The error analysis of each model shown in Fig. 2 indicates that the 4-Period Moving Average model is superior to the Exponential Moving Average
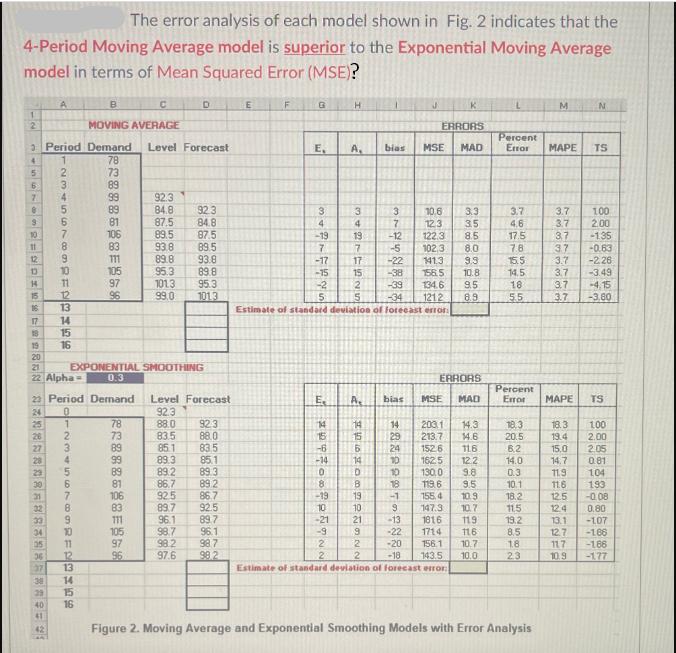
The error analysis of each model shown in Fig. 2 indicates that the 4-Period Moving Average model is superior to the Exponential Moving Average model in terms of Mean Squared Error (MSE)? 1 2 3 Period Demand 45676220 234567NCOREPRISE 10 11 13 12 9 14 15 16 17 18 19 20 21 EN SZERARRANXA9=91 A 25 26 05 8 36 10 11 12 13 22 Alpha= 41 14 42 15 24 0 1 16 -234567CSRFENHES 10 23 Period Demand 78 11 37 13 12 38 14 29 15 B C MOVING AVERAGE 40 16 22888538ESTS 78 73 EXPONENTIAL SMOOTHING 0.3 89 99 89 106 111 105 97 96 22888588ES 73 89 99 89 81 106 83 111 105 97 96 Level Forecast 92.3 84.8 92.3 87.5 84.8 89.5 87.5 93.8 89.5 89.8 93.8 95.3 89.8 101.3 95.3 99,0 1013 D T Level Forecast 92.3 88.0 83.5 851 89.2 86.7 92.5 89.7 92.3 88.0 83.5 89.3 85.1 89.3 96.1 98.7 98.2 97.6 89.2 86.7 92.5 89.7 96.1 98.7 98.2 E F G 3 4 -19 7 -17 -15 -2 5 E. 14 15 -6 -14 -19 10 -21 -9 2 H A 3 10.6 7 12.3 -12 122.3 -5 8.0 102,3 -22 1413 9.3 -38 -39 158.5 134.6 -34 1212 Estimate of standard deviation of forecast error. 2 104 MARTTEN 3 4 19 7 17 15 2 5 14 15 6 A bias 14 D NONSBE 1 19 21 ERRORS bias MSE MAD #SAPOPTOANAR 14 29 24 10 10 J 18 -13 K -22 050 S 203.1 14.3 14.6 213.7 152.6 11.6 162.5 12.2 130.0 9.8 119.6 9.5 155.4 10.9 147.3 10.7 1816 119 1714 116 -20 156.1 10.7 -18 143.5 10.0 3.3 2 Estimate of standard deviation of forecast error: 35 8.5 SOSB in 10.8 9.5 8.9 ERRORS MSE MAD L 3.7 4.6 17.5 7.8 15.5 14.5 18 5.5 Percent Error MAPE TS Percent Error PROHORRER BIZ 18.3 52253N-WON5E 20.5 8.2 14.0 0.3 10.1 18.2 11.5 19.2 8.5 18 23 M Figure 2. Moving Average and Exponential Smoothing Models with Error Analysis 7777 35 35 35 37 37 3.7 100 3.7 2.00 3.7 -1.35 3.7 -0.63 3.7 -2.26 3.7 -3.49 www 777 3.7 N -4.15 3.7 -3.80 MAPE TS 18.3 19.4 100 2.00 15.0 2.05 14.7 0.81 119 104 116 193 12.5 -0.08 124 0.80 -107 -186 13.1 12.7 117 -186 10.9 -177
Step by Step Solution
There are 3 Steps involved in it
The image youve provided contains a table with error analysis for two different forecasting models t... View full answer

Get step-by-step solutions from verified subject matter experts