

Question: The Even More Music worksheet in the data pack represents a random sample of hit songs (released in the 1980's, 1990's, 2000's, and 2010's)
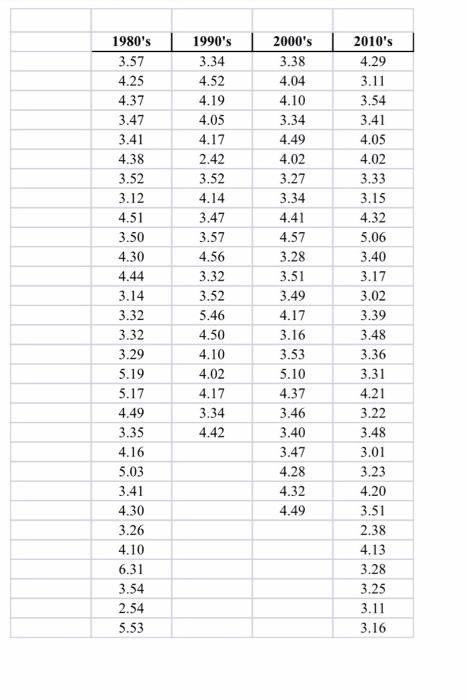
The "Even More Music" worksheet in the data pack represents a random sample of hit songs (released in the 1980's, 1990's, 2000's, and 2010's) and their length (measured in minutes). a. Using a 5% significance level, conduct an appropriate hypothesis test to determine whether the average length of a song differs by decade. (10 marks) b. Construct and interpret a 95% confidence interval for the difference in the average length of a song released in the 1990's and 2010's. (5 marks) 1980's 1990's 2000's 2010's 3.57 3.34 3.38 4.29 4.25 4.52 4.04 3.11 4.37 4.19 4.10 3.54 3.47 4.05 3.34 3.41 3.41 4.17 4.49 4.05 4.38 2.42 4.02 4.02 3.52 3.52 3.27 3.33 3.12 4.14 3.34 3.15 4.51 3.47 4.41 4.32 3.50 3.57 4.57 5.06 4.30 4.56 3.28 3.40 4.44 3.32 3.51 3.17 3.14 3.52 3.49 3.02 3.32 5.46 4.17 3.39 3.32 4.50 3.16 3.48 3.29 4.10 3.53 3.36 5.19 4.02 5.10 3.31 5.17 4.17 4.37 4.21 4.49 3.34 3.46 3.22 3.35 4.42 3.40 3.48 4.16 3.47 3.01 5.03 4.28 3.23 3.41 4.32 4.20 4.30 4.49 3.51 3.26 2.38 4.10 4.13 6.31 3.28 3.54 3.25 2.54 3.11 5.53 3.16
Step by Step Solution
3.39 Rating (152 Votes )
There are 3 Steps involved in it
a The problem is solved using MS Excel We select Data Data Analysis Single ... View full answer

Get step-by-step solutions from verified subject matter experts