

Question: The Example 3 . 1 in the Lee text, Well Testing provides the following data. These data were obtained from a constant rate pressure drawdown
The Example in the Lee text, Well Testing provides the
following data. These data were obtained from a constant rate
"pressure drawdown" test performed on an oil well use the liquid
relations for analysis
Reservoir properties:
Oil properties:
Production parameters:
psia
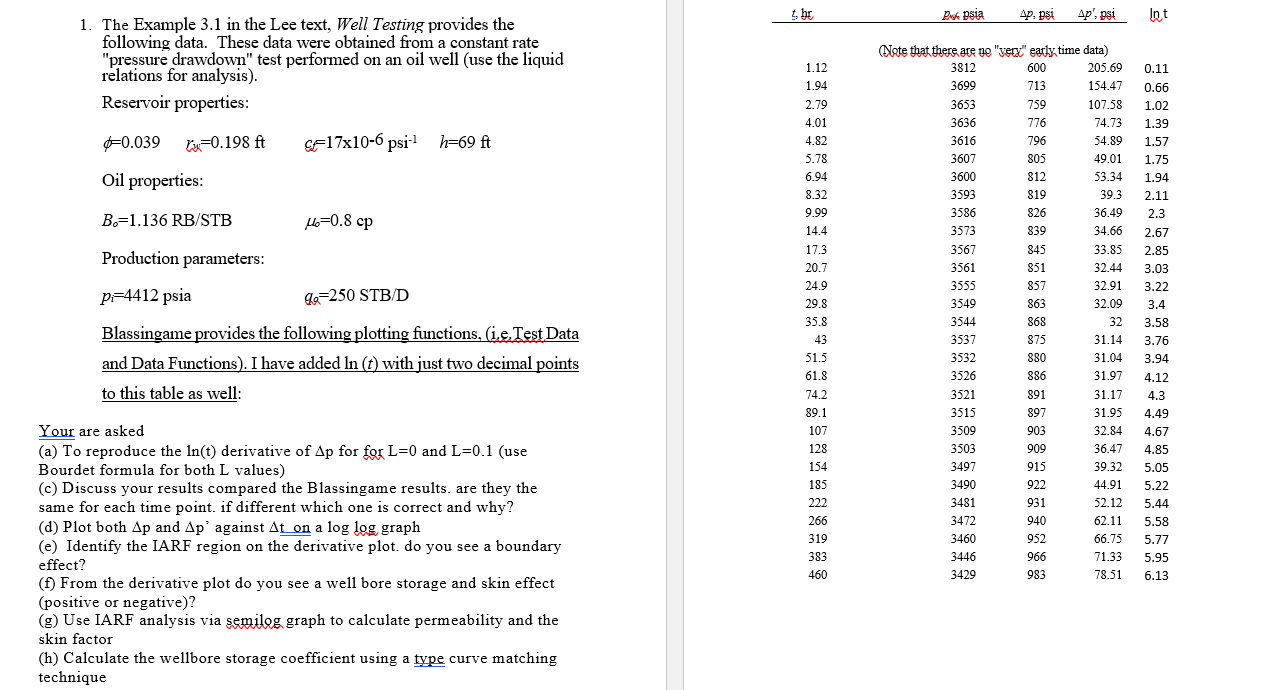
Blassingame provides the following plotting functions, ieTest,Data
and Data Functions I have added with just two decimal points
to this table as well:
Your are asked
a To reproduce the derivative of for for and use
Bourdet formula for both values
c Discuss your results compared the Blassingame results. are they the
same for each time point. if different which one is correct and why?
d Plot both and against on a log log graph
e Identify the IARF region on the derivative plot. do you see a boundary
effect?
f From the derivative plot do you see a well bore storage and skin effect
positive or negative
g Use IARF analysis via semilog graph to calculate permeability and the
skin factor
h Calculate the wellbore storage coefficient using a type curve matching
technique
pok Dsia
Dete that there are ne "yerd" early time data
Step by Step Solution
There are 3 Steps involved in it
1 Expert Approved Answer
Step: 1 Unlock

Question Has Been Solved by an Expert!
Get step-by-step solutions from verified subject matter experts
Step: 2 Unlock
Step: 3 Unlock