

Question: The Excel file Closing Stock Prices provides data for four stocks and the Dow Jones Industrial Average over a one - month period. Develop a
The Excel fileClosing Stock Pricesprovides data for four stocks and the Dow Jones Industrial Average over a onemonth period.
Develop a spreadsheet for forecasting each of the stock prices and the DJIA using a simple twoperiod and threeperiod moving average.
Compute MAD, MSE, and MAPE and determine whether two or three moving average periods is better.
The Excel fileClosing Stock Pricesprovides data for four stocks and the Dow Jones Industrial Average over a onemonth period.
Develop a spreadsheet model for forecasting each of the stock prices using simple exponential smoothing with a smoothing constant of
Compare your results to the output from ExcelsData Analysistool
Compute MAD, MSE, and MAPE.
Does a smoothing constant ofor yield better results?
Consider the prices for the Dow Jones Industrials in the Excel file Closing Stock Prices. Use simple linear regression to forecast the data. What would be the forecasts for the next three days? begintabularcccccc
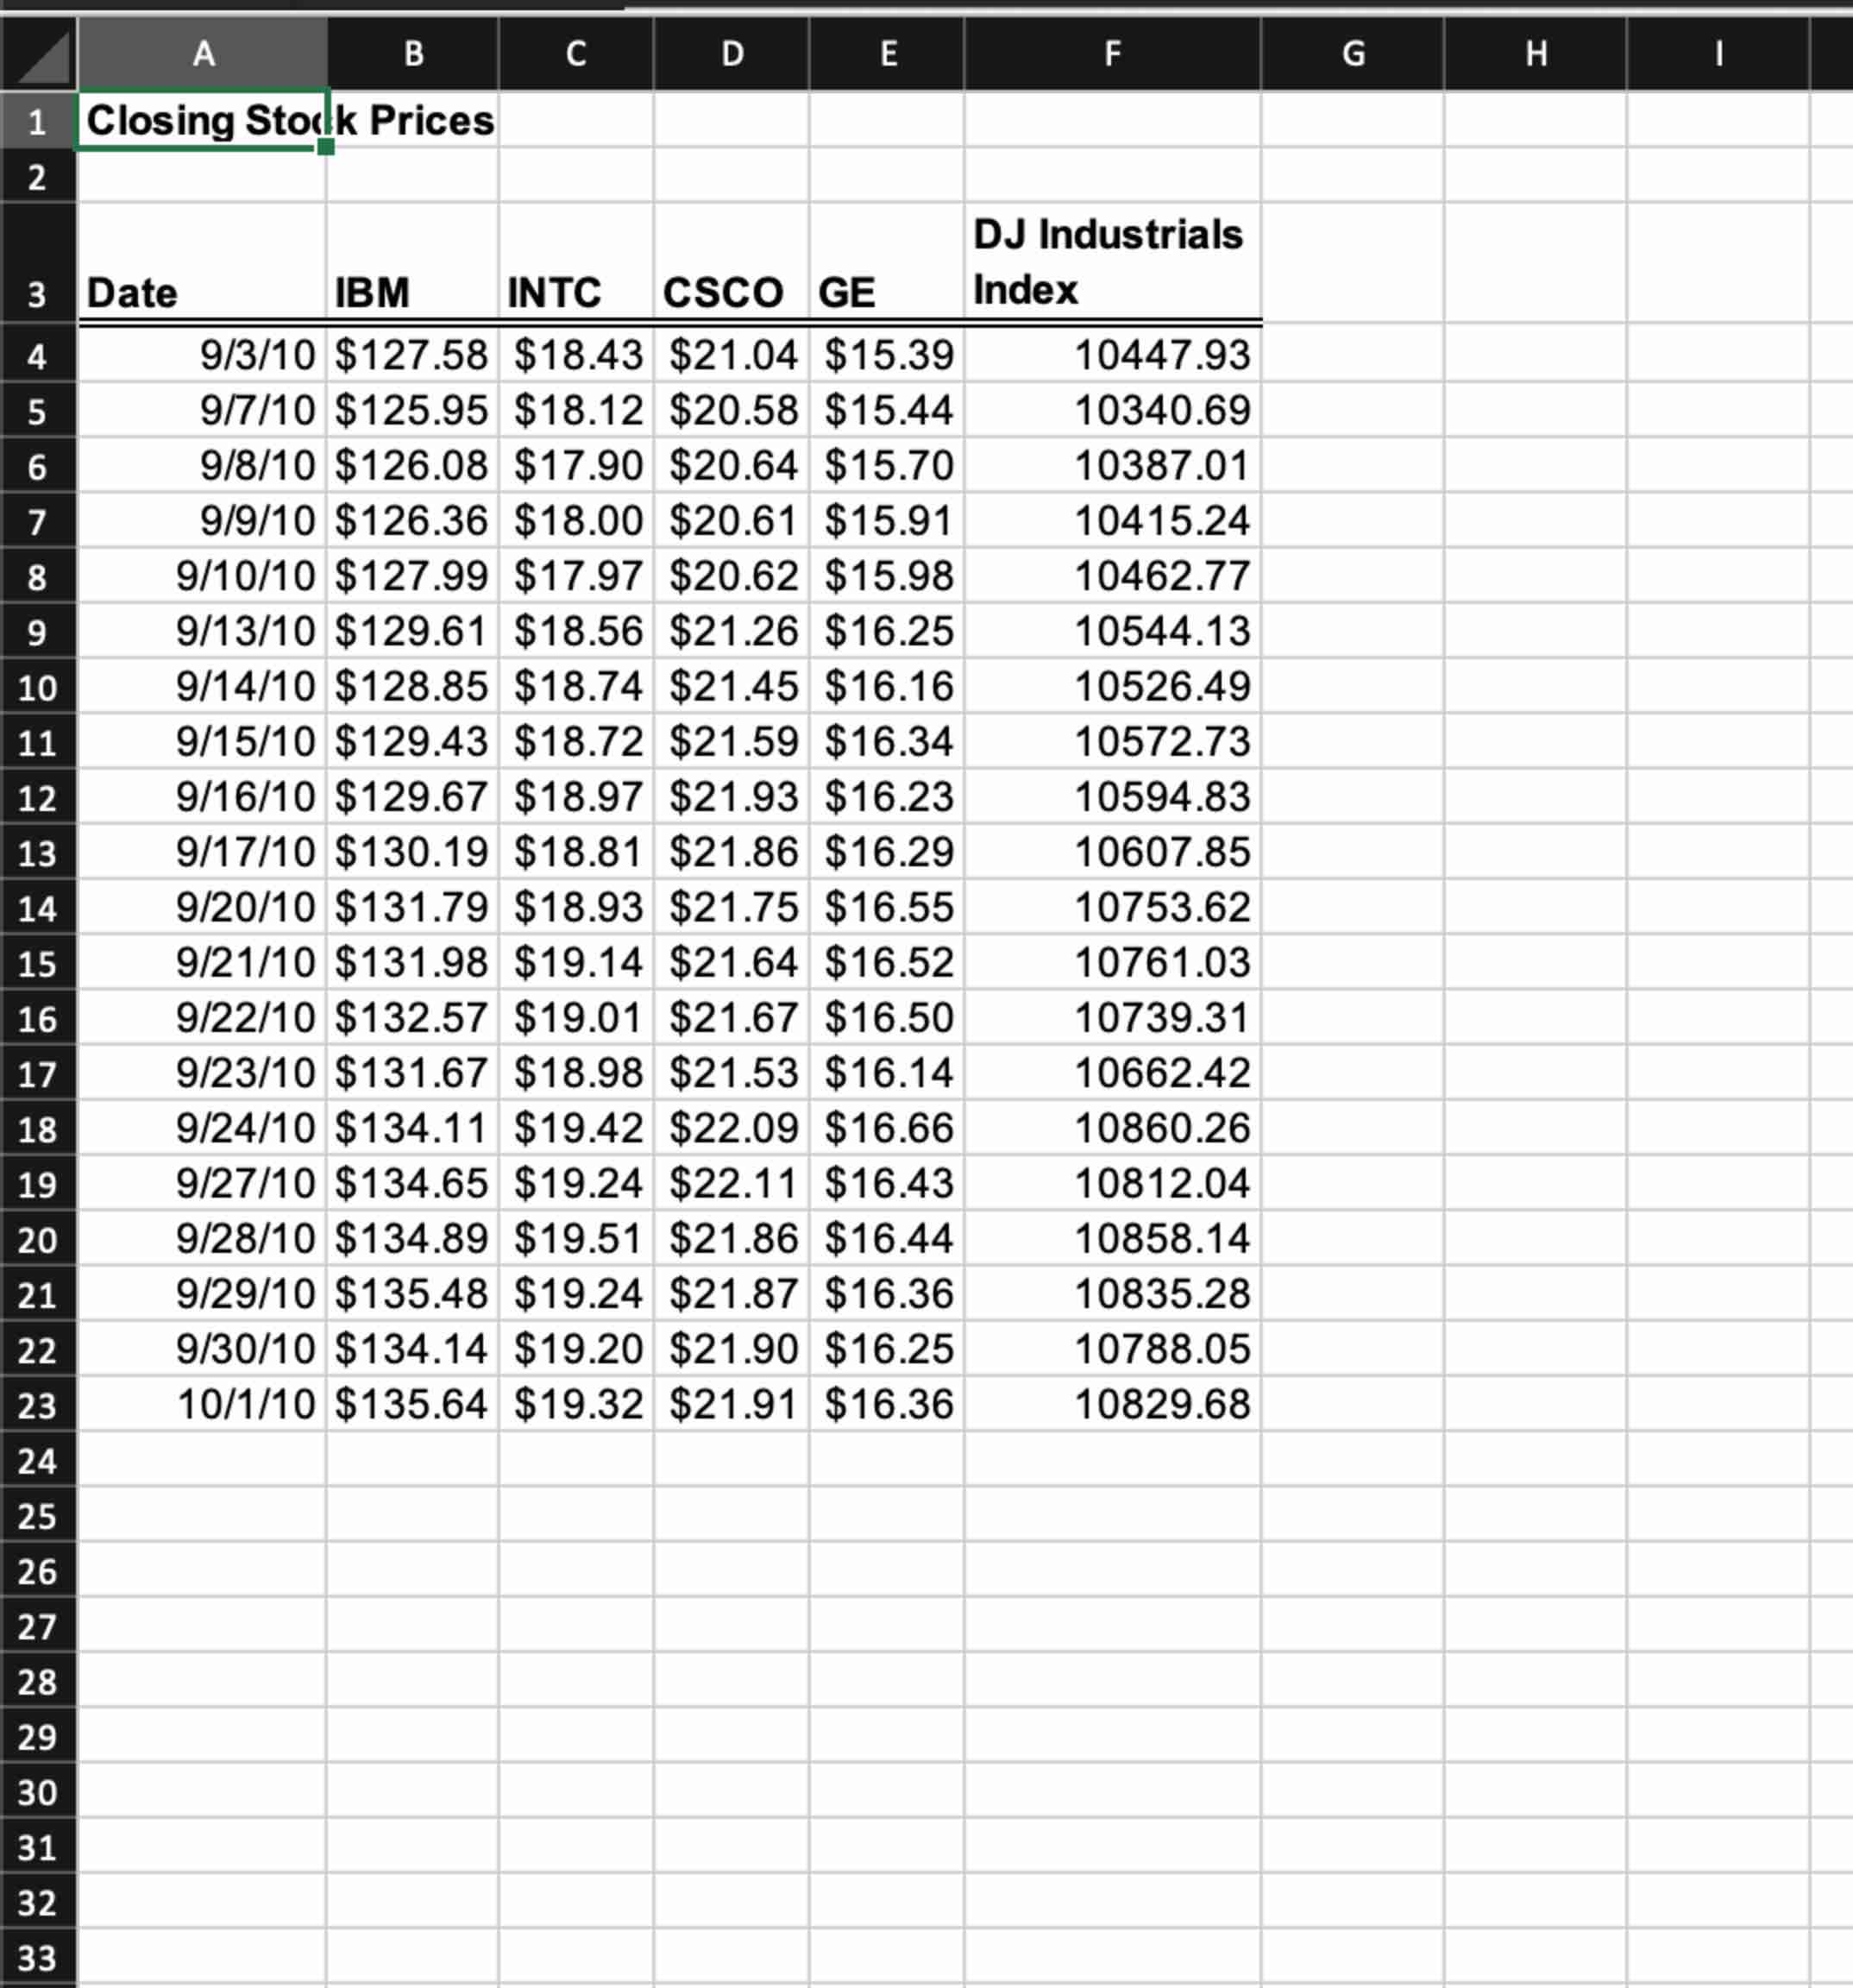
hline Closing Stod & k Prices & & & &
hline Date & IBM & INTC & CSCO & GE & DJ Industrials Index
hline & $ & $ & $ & $ &
hline & $ & $ & $ & $ &
hline & $ & $ & $ & $ &
hline & $ & $ & $ & $ &
hline & $ & $ & $ & $ &
hline & $ & $ & $ & $ &
hline & $ & $ & $ & $ &
hline & $ & $ & $ & $ &
hline & $ & $ & $ & $ &
hline & $ & $ & $ & $ &
hline & $ & $ & $ & $ &
hline & $ & $ & $ & $ &
hline & $ & $ & $ & $ &
hline & $ & $ & $ & $ &
hline & $ & $ & $ & $ &
hline & $ & $ & $ & $ &
hline & $ & $ & $ & $ &
hline & $ & $ & $ & $ &
hline & $ & $ & $ & $ &
hline & $ & $ & $ & $ &
hline
endtabular
Step by Step Solution
There are 3 Steps involved in it
1 Expert Approved Answer
Step: 1 Unlock

Question Has Been Solved by an Expert!
Get step-by-step solutions from verified subject matter experts
Step: 2 Unlock
Step: 3 Unlock