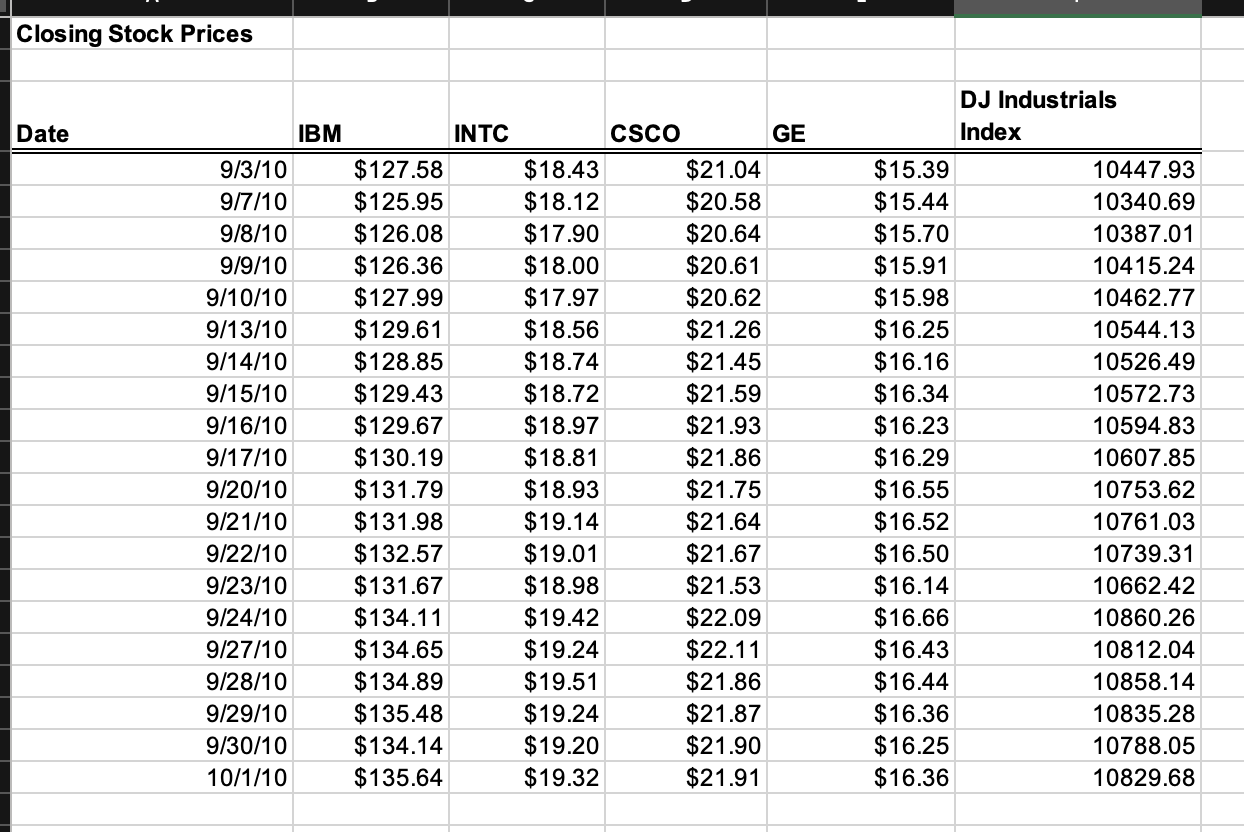
Question: The Excel file Closing Stock Prices provides data for four stocks and the Dow Jones Industrial Average over a one-month period. a) Develop a spreadsheet

The Excel file Closing Stock Prices provides dataThe Excel file Closing Stock Prices provides data

The Excel file Closing Stock Prices provides data for four stocks and the Dow Jones Industrial Average over a one-month period. a) Develop a spreadsheet model for forecasting each of the stock prices using simple exponential smoothing with a smoothing constance of 0.3. b) Compare your results to the output from Excels Data Analysis tool. c) Compute MAD, MSE and MAPE. d) Does a smoothing constance of 0.1 or 0.5 yield better results? Closing Stock Prices Date IBM INTC 9/3/10 $127.58 9/7/10 $125.95 9/8/10 $126.08 9/9/10 $126.36 9/10/10 $127.99 9/13/10 $129.61 9/14/10 $128.85 9/15/10 $129.43 9/16/10 $129.67 9/17/10 $130.19 9/20/10 $131.79 9/21/10 $131.98 9/22/10 $132.57 9/23/10 $131.67 9/24/10 $134.11 9/27/10 $134.65 9/28/10 $134.89 9/29/10 $135.48 9/30/10 $134.14 10/1/10 $135.64 CSCO GE $18.43 $21.04 $18.12 $20.58 $17.90 $20.64 $18.00 $20.61 $17.97 $20.62 $18.56 $21.26 $18.74 $21.45 $18.72 $21.59 $18.97 $21.93 $18.81 $21.86 $18.93 $21.75 $19.14 $21.64 $19.01 $21.67 $18.98 $21.53 $19.42 $22.09 $19.24 $22.11 $19.51 $21.86 $19.24 $21.87 $19.20 $21.90 $19.32 $21.91 DJ Industrials Index $15.39 10447.93 $15.44 10340.69 $15.70 10387.01 $15.91 10415.24 $15.98 10462.77 $16.25 10544.13 $16.16 10526.49 $16.34 10572.73 $16.23 10594.83 $16.29 10607.85 $16.55 10753.62 $16.52 10761.03 $16.50 10739.31 $16.14 10662.42 $16.66 10860.26 $16.43 10812.04 $16.44 10858.14 $16.36 10835.28 $16.25 10788.05 $16.36 10829.68

Step by Step Solution

There are 3 Steps involved in it

1 Expert Approved Answer
Step: 1 Unlock blur-text-image
Question Has Been Solved by an Expert!

Get step-by-step solutions from verified subject matter experts

Step: 2 Unlock
Step: 3 Unlock

Students Have Also Explored These Related General Management Questions!