

Question: The excel file contains two graphs that were generated from the residuals from our Mortgage model. What does Graph 1 tell you about our model?
The excel file contains two graphs that were generated from the residuals from our Mortgage model.
What does Graph 1 tell you about our model?
What does graph 2 tell you about the mortgage model?
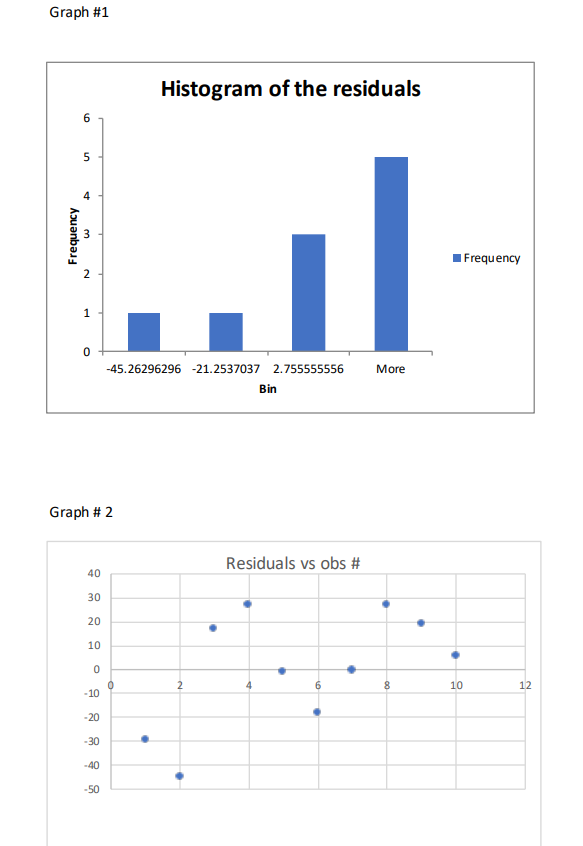
Graph #1 Histogram of the residuals 1126296296 2 1. 33163? 2.?55555556 Mm.- Bil Graph# 2 m Residuals vs obs # 30 I I 20 - i l ID - III .e s 2 4 s s m 12 I
Step by Step Solution
There are 3 Steps involved in it
1 Expert Approved Answer
Step: 1 Unlock

Question Has Been Solved by an Expert!
Get step-by-step solutions from verified subject matter experts
Step: 2 Unlock
Step: 3 Unlock