

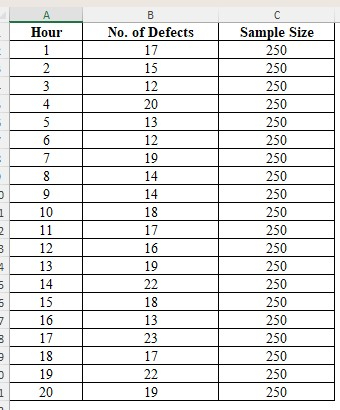
Question: The excel file from a production process that makes 2 5 0 units each hour. The data was collected over a normal 1 2 -
The excel file from a production process that makes units each hour. The data was collected over a normal hour shift one day.
a Which control chart would be appropriate for this example and why?
b Report LCL
c Report centerline.
d Report UCL.
e Create a control chart in Excel and JMP and provide both screenshots.
f Evaluate whether the process is in control and provide your insights.
Step by Step Solution
There are 3 Steps involved in it
1 Expert Approved Answer
Step: 1 Unlock

Question Has Been Solved by an Expert!
Get step-by-step solutions from verified subject matter experts
Step: 2 Unlock
Step: 3 Unlock