

Question: The excel file is the solution but is not complete yet. I attached it perhaps helps you get a clue of it. Honestly, I don't
The excel file is the solution but is not complete yet. I attached it perhaps helps you get a clue of it. Honestly, I don't know how to move on...
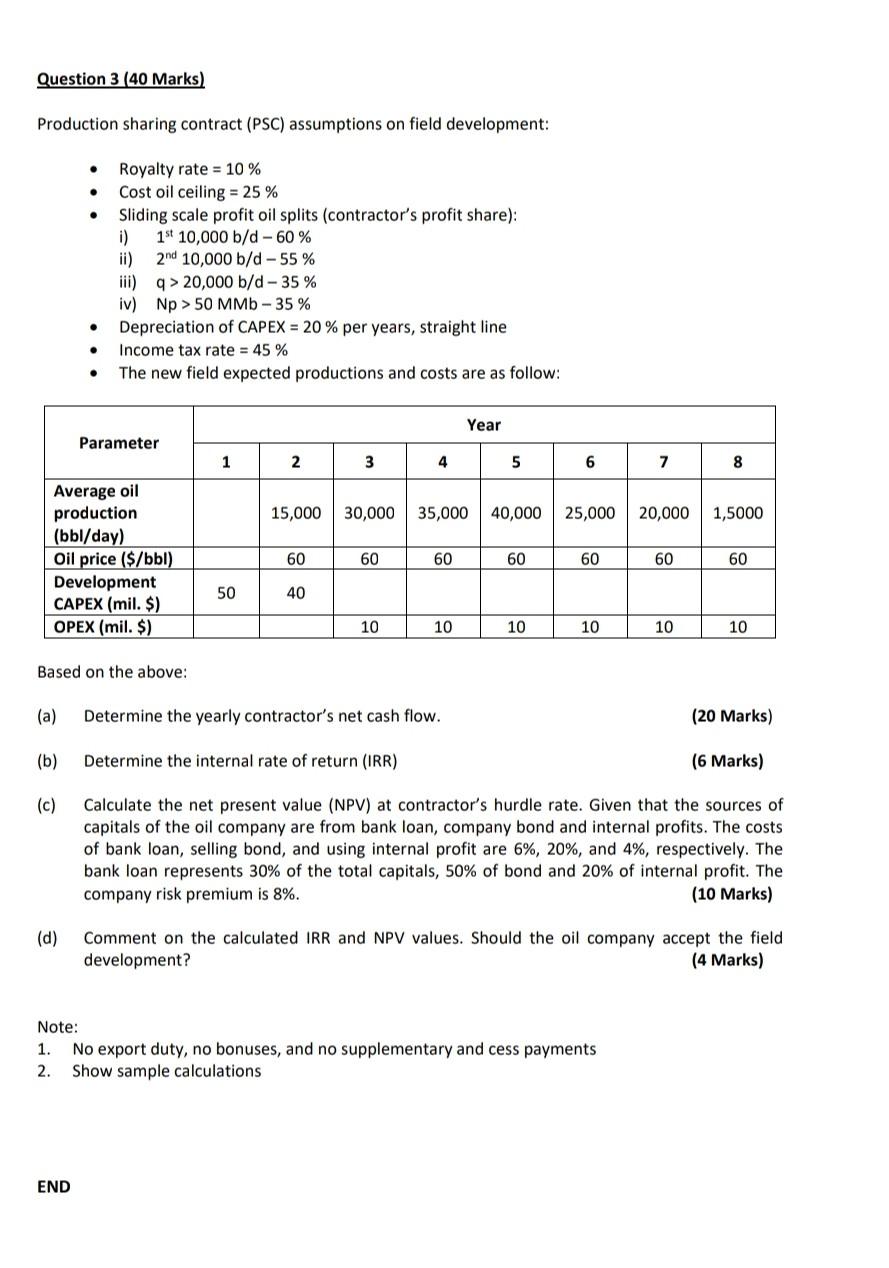
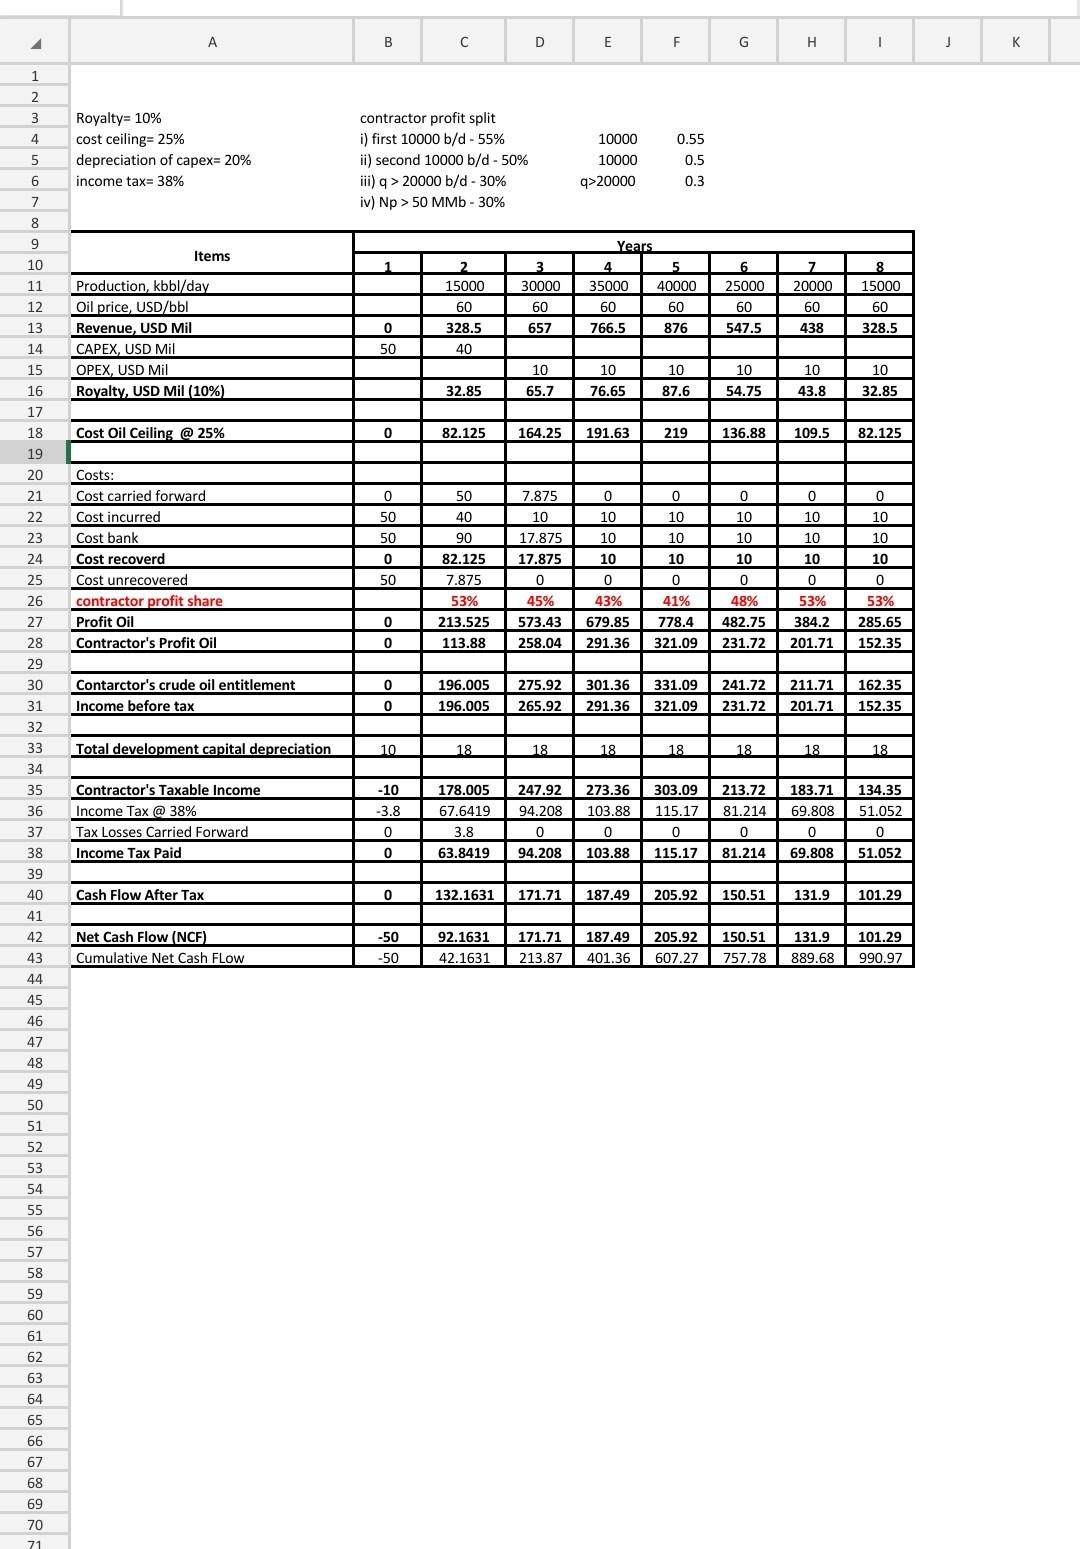
Question 3 (40 Marks) Production sharing contract (PSC) assumptions on field development: . Royalty rate = 10 % Cost oil ceiling = 25 % Sliding scale profit oil splits (contractor's profit share): i) 1st 10,000 b/d -60% ii) 2nd 10,000 b/d -55% iii) q> 20,000 b/d -35% iv) Np > 50 MM. - 35 % Depreciation of CAPEX = 20% per years, straight line Income tax rate = 45% The new field expected productions and costs are as follow: . Year Parameter 1 2 3 4 5 6 7 8 15,000 30,000 35,000 40,000 25,000 20,000 1,5000 1,5000 Average oil production (bbl/day) Oil price ($/bbl) Development CAPEX (mil. $) OPEX (mil. $) 60 60 60 60 60 60 60 50 40 10 10 10 10 10 10 Based on the above: (a) Determine the yearly contractor's net cash flow. (20 Marks) (b) Determine the internal rate of return (IRR) (6 Marks) (c) Calculate the net present value (NPV) at contractor's hurdle rate. Given that the sources of capitals of the oil company are from bank loan, company bond and internal profits. The costs of bank loan, selling bond, and using internal profit are 6%, 20%, and 4%, respectively. The bank loan represents 30% of the total capitals, 50% of bond and 20% of internal profit. The company risk premium is 8%. (10 Marks) (d) Comment on the calculated IRR and NPV values. Should the oil company accept the field development? (4 Marks) Note: 1. No export duty, no bonuses, and no supplementary and cess payments 2. Show sample calculations END 4 A B D E F G H 1 j 1 2 3 4 Royalty= 10% cost ceiling= 25% depreciation of capex=20% income tax= 38% 5 6 contractor profit split i) first 10000 b/d - 55% ii) second 10000 b/d - 50% iii) > 20000 b/d -30% iv) Np > 50 MM. - 30% 10000 10000 q>20000 0.55 0.5 0.3 7 8 Items 9 10 11 2 15000 60 3 30000 60 657 Years 4 5 35000 40000 60 60 766.5 876 6 25000 60 547.5 7 20000 60 438 8 15000 60 328.5 12 328.5 13 14 Production, kbbl/day Oil price, USD/bbl Revenue, USD Mil CAPEX, USD Mil OPEX, USD Mil Royalty, USD Mil (10%) 0 50 40 15 16 17 10 65.7 10 76.65 10 87.6 10 54.75 10 43.8 10 32.85 32.85 18 Cost Oil Ceiling @ 25% 0 82.125 164.25 191.63 219 136.88 109.5 82.125 19 20 0 0 0 21 22 23 50 50 Costs: Cost carried forward Cost incurred Cost bank Cost recoverd Cost unrecovered contractor profit share Profit Oil Contractor's Profit Oil 0 10 10 10 24 25 26 27 28 0 50 50 40 90 82.125 7.875 53% 213.525 113.88 7.875 10 17.875 17.875 0 45% 573.43 258.04 10 10 10 0 43% 679.85 291.36 0 10 10 10 0 41% 778.4 321.09 10 10 10 0 48% 482.75 231.72 0 10 10 10 0 53% 285.65 152.35 0 53% 384.2 201.71 0 0 29 30 0 Contarctor's crude oil entitlement Income before tax 196.005 196.005 275.92 265.92 301.36 291.36 331.09 321.09 241.72 211.71 231.72 201.71 162.35 152.35 31 0 32 33 Total development capital depreciation 10 18 18 18 18 18 18 18 34 35 -10 -3.8 273.36 103.88 213.72 81.214 36 Contractor's Taxable income Income Tax @ 38% Tax Losses Carried Forward Income Tax Paid 178.005 67.6419 3.8 63.8419 247.92 94.208 0 94.208 303.09 115.17 0 115.17 183.71 69.808 0 69.808 134.35 51.052 0 51.052 0 0 37 38 0 0 103.88 81.214 39 40 Cash Flow After Tax 0 132.1631 171.71 187.49 205.92 150.51 131.9 101.29 41 42 Net Cash Flow (NCF) Cumulative Net Cash Flow -50 -50 92.1631 42.1631 171.71 213.87 187.49 401.36 205.92 607.27 150.51 757.78 131.9 889.68 101.29 990.97 43 44 45 46 47 48 49 50 51 52 53 54 55 56 57 58 59 60 61 62 63 64 65 66 67 68 69 70 71 Question 3 (40 Marks) Production sharing contract (PSC) assumptions on field development: . Royalty rate = 10 % Cost oil ceiling = 25 % Sliding scale profit oil splits (contractor's profit share): i) 1st 10,000 b/d -60% ii) 2nd 10,000 b/d -55% iii) q> 20,000 b/d -35% iv) Np > 50 MM. - 35 % Depreciation of CAPEX = 20% per years, straight line Income tax rate = 45% The new field expected productions and costs are as follow: . Year Parameter 1 2 3 4 5 6 7 8 15,000 30,000 35,000 40,000 25,000 20,000 1,5000 1,5000 Average oil production (bbl/day) Oil price ($/bbl) Development CAPEX (mil. $) OPEX (mil. $) 60 60 60 60 60 60 60 50 40 10 10 10 10 10 10 Based on the above: (a) Determine the yearly contractor's net cash flow. (20 Marks) (b) Determine the internal rate of return (IRR) (6 Marks) (c) Calculate the net present value (NPV) at contractor's hurdle rate. Given that the sources of capitals of the oil company are from bank loan, company bond and internal profits. The costs of bank loan, selling bond, and using internal profit are 6%, 20%, and 4%, respectively. The bank loan represents 30% of the total capitals, 50% of bond and 20% of internal profit. The company risk premium is 8%. (10 Marks) (d) Comment on the calculated IRR and NPV values. Should the oil company accept the field development? (4 Marks) Note: 1. No export duty, no bonuses, and no supplementary and cess payments 2. Show sample calculations END 4 A B D E F G H 1 j 1 2 3 4 Royalty= 10% cost ceiling= 25% depreciation of capex=20% income tax= 38% 5 6 contractor profit split i) first 10000 b/d - 55% ii) second 10000 b/d - 50% iii) > 20000 b/d -30% iv) Np > 50 MM. - 30% 10000 10000 q>20000 0.55 0.5 0.3 7 8 Items 9 10 11 2 15000 60 3 30000 60 657 Years 4 5 35000 40000 60 60 766.5 876 6 25000 60 547.5 7 20000 60 438 8 15000 60 328.5 12 328.5 13 14 Production, kbbl/day Oil price, USD/bbl Revenue, USD Mil CAPEX, USD Mil OPEX, USD Mil Royalty, USD Mil (10%) 0 50 40 15 16 17 10 65.7 10 76.65 10 87.6 10 54.75 10 43.8 10 32.85 32.85 18 Cost Oil Ceiling @ 25% 0 82.125 164.25 191.63 219 136.88 109.5 82.125 19 20 0 0 0 21 22 23 50 50 Costs: Cost carried forward Cost incurred Cost bank Cost recoverd Cost unrecovered contractor profit share Profit Oil Contractor's Profit Oil 0 10 10 10 24 25 26 27 28 0 50 50 40 90 82.125 7.875 53% 213.525 113.88 7.875 10 17.875 17.875 0 45% 573.43 258.04 10 10 10 0 43% 679.85 291.36 0 10 10 10 0 41% 778.4 321.09 10 10 10 0 48% 482.75 231.72 0 10 10 10 0 53% 285.65 152.35 0 53% 384.2 201.71 0 0 29 30 0 Contarctor's crude oil entitlement Income before tax 196.005 196.005 275.92 265.92 301.36 291.36 331.09 321.09 241.72 211.71 231.72 201.71 162.35 152.35 31 0 32 33 Total development capital depreciation 10 18 18 18 18 18 18 18 34 35 -10 -3.8 273.36 103.88 213.72 81.214 36 Contractor's Taxable income Income Tax @ 38% Tax Losses Carried Forward Income Tax Paid 178.005 67.6419 3.8 63.8419 247.92 94.208 0 94.208 303.09 115.17 0 115.17 183.71 69.808 0 69.808 134.35 51.052 0 51.052 0 0 37 38 0 0 103.88 81.214 39 40 Cash Flow After Tax 0 132.1631 171.71 187.49 205.92 150.51 131.9 101.29 41 42 Net Cash Flow (NCF) Cumulative Net Cash Flow -50 -50 92.1631 42.1631 171.71 213.87 187.49 401.36 205.92 607.27 150.51 757.78 131.9 889.68 101.29 990.97 43 44 45 46 47 48 49 50 51 52 53 54 55 56 57 58 59 60 61 62 63 64 65 66 67 68 69 70 71
Step by Step Solution
There are 3 Steps involved in it

Get step-by-step solutions from verified subject matter experts