

Question: The Excel Sensitivity Report for this problem is shown in the table below. Calculate and explain what happens to the optimal solution for each of
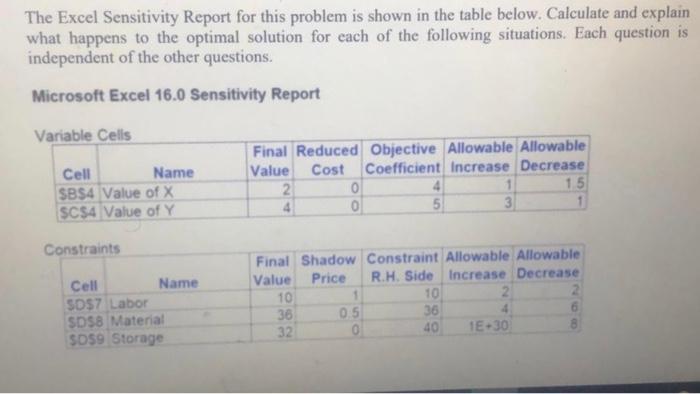
The Excel Sensitivity Report for this problem is shown in the table below. Calculate and explain what happens to the optimal solution for each of the following situations. Each question is independent of the other questions. Microsoft Excel 16.0 Sensitivity Report Variable Cells Cell Name $B$4 Value of X SC$4 Value of Y Final Reduced Objective Allowable Allowable Value Cost Coefficient Increase Decrease 2 o 4 15 4 0 5 3 1 Constraints Cell Name SD$7 Labor SD$8 Material 5059 Storage Final Shadow Constraint Allowable Allowable Value Price R.H. Side Increase Decrease 10 10 2 36 0.5 36 4 32 40 1E-30 6. What is the optimal objective function value? For the toolbar, press ALT F10 (PC) or ALTFNF10 (Mac). B I YS Paragraph Arial The Excel Sensitivity Report for this problem is shown in the table below. Calculate and explain what happens to the optimal solution for each of the following situations. Each question is independent of the other questions. Microsoft Excel 16.0 Sensitivity Report Variable Cells Cell Name $B$4 Value of X SC$4 Value of Y Final Reduced Objective Allowable Allowable Value Cost Coefficient Increase Decrease 2 o 4 15 4 0 5 3 1 Constraints Cell Name SD$7 Labor SD$8 Material 5059 Storage Final Shadow Constraint Allowable Allowable Value Price R.H. Side Increase Decrease 10 10 2 36 0.5 36 4 32 40 1E-30 6. What is the optimal objective function value? For the toolbar, press ALT F10 (PC) or ALTFNF10 (Mac). B I YS Paragraph Arial
Step by Step Solution
There are 3 Steps involved in it

Get step-by-step solutions from verified subject matter experts