

Question: The execution times for three systems running five benchmarks are shown in the table below. Compare the relative performance of each of these systems (ie,
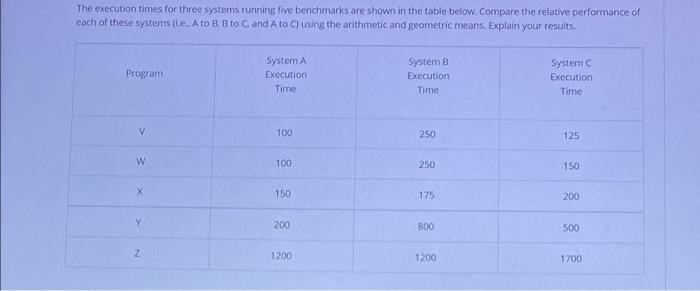
The execution times for three systems running five benchmarks are shown in the table below. Compare the relative performance of each of these systems (ie, A to B B to C and A to using the arithmetic and geometric means. Explain your results, Program System A Execution Time System B Execution Time System Execution Time V 100 250 125 W 100 250 150 150 175 200 Y 200 800 500 Z 1200 1200 1700
Step by Step Solution
There are 3 Steps involved in it
1 Expert Approved Answer
Step: 1 Unlock

Question Has Been Solved by an Expert!
Get step-by-step solutions from verified subject matter experts
Step: 2 Unlock
Step: 3 Unlock