

Question: The expected is: Exercise 2.3. Using Python, generate the QQ-plot by doing the following: 1. Read the data and select only the largest 270 observations
The expected is:
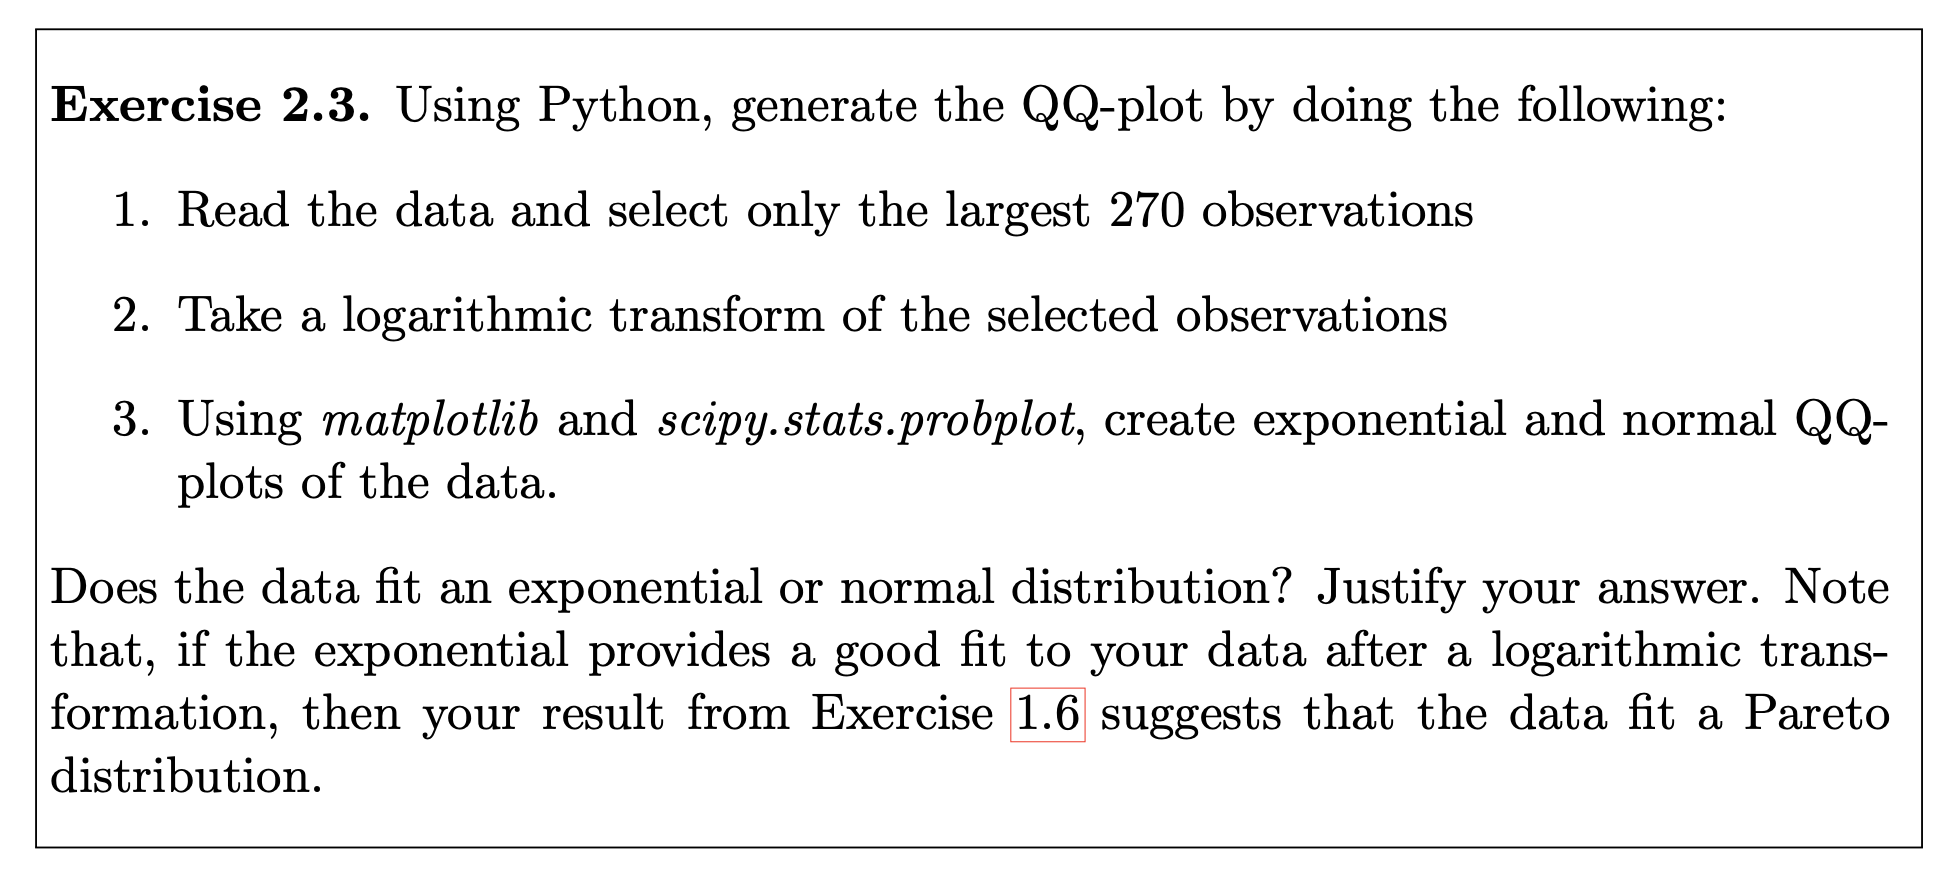
Exercise 2.3. Using Python, generate the QQ-plot by doing the following: 1. Read the data and select only the largest 270 observations 2. Take a logarithmic transform of the selected observations 3. Using matplotlib and scipy.stats.pr0bplot, create exponential and normal QQ plots of the data. Does the data t an exponential or normal distribution? Justify your answer. Note that, if the exponential provides a good t to your data after a logarithmic trans- formation, then your result from Exercise 1.6 suggests that the data t a Pareto distribution
Step by Step Solution
There are 3 Steps involved in it
1 Expert Approved Answer
Step: 1 Unlock

Question Has Been Solved by an Expert!
Get step-by-step solutions from verified subject matter experts
Step: 2 Unlock
Step: 3 Unlock