

Question: The Expenditure Diagram E E E a a :1 6| 6| 3 g a 3 e 5. 0. ll] 20 30 40 50 60 70
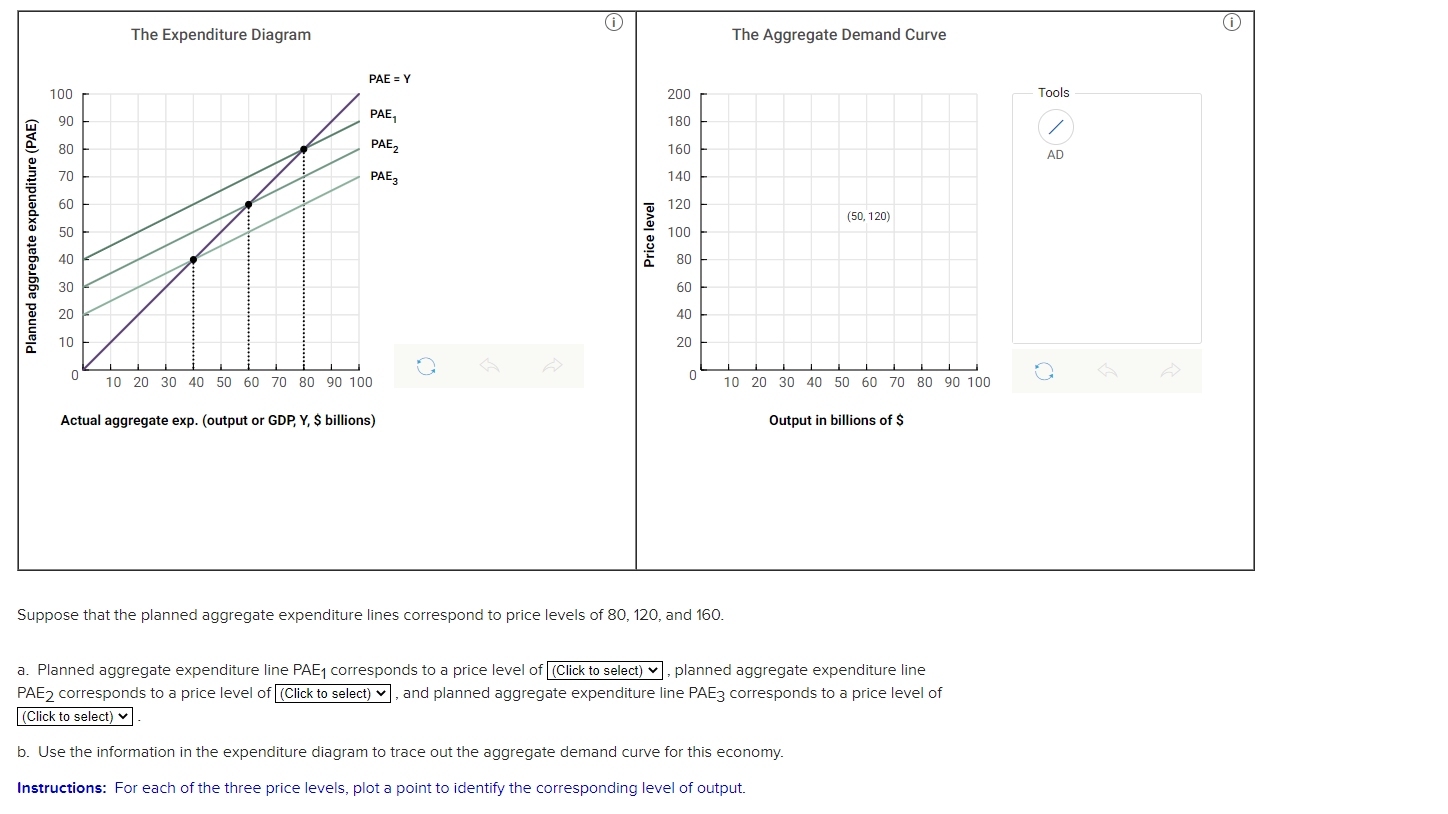
The Expenditure Diagram E E E a a :1 6| 6| 3 g a 3 e 5. 0. ll] 20 30 40 50 60 70 80 90100 Actual aggregate exp. (output or GDP, Y, S billions) Suppose that the planned aggregate expenditure lines correspond to price a. Planned aggregate expenditure line PAE1 corresponds to a price level of The Aggregate Demand Curve [51120) Price level ll] 20 30 40 50 60 7'0 80 BDlOO Output In billions of s evels of 80, 120, and 160. (Click to seled) v , planned aggregate expenditure line PAE2 corresponds to a price level of (Cllckto select) v ,and planned aggregate expenditure ine PAEg corresponds to a price level of (Cllck to select) v , b. Use the information in the expenditure diagram to trace outthe aggregate demand curve for this economy. Instructions: For each of the three price levels, plot a point to identify the corresponding level of output
Step by Step Solution
There are 3 Steps involved in it

Get step-by-step solutions from verified subject matter experts