

Question: The experiment process generated three disjoint groups of customers: Group Name Description #customers A Assigned to new platform: 90 B The weekly order was
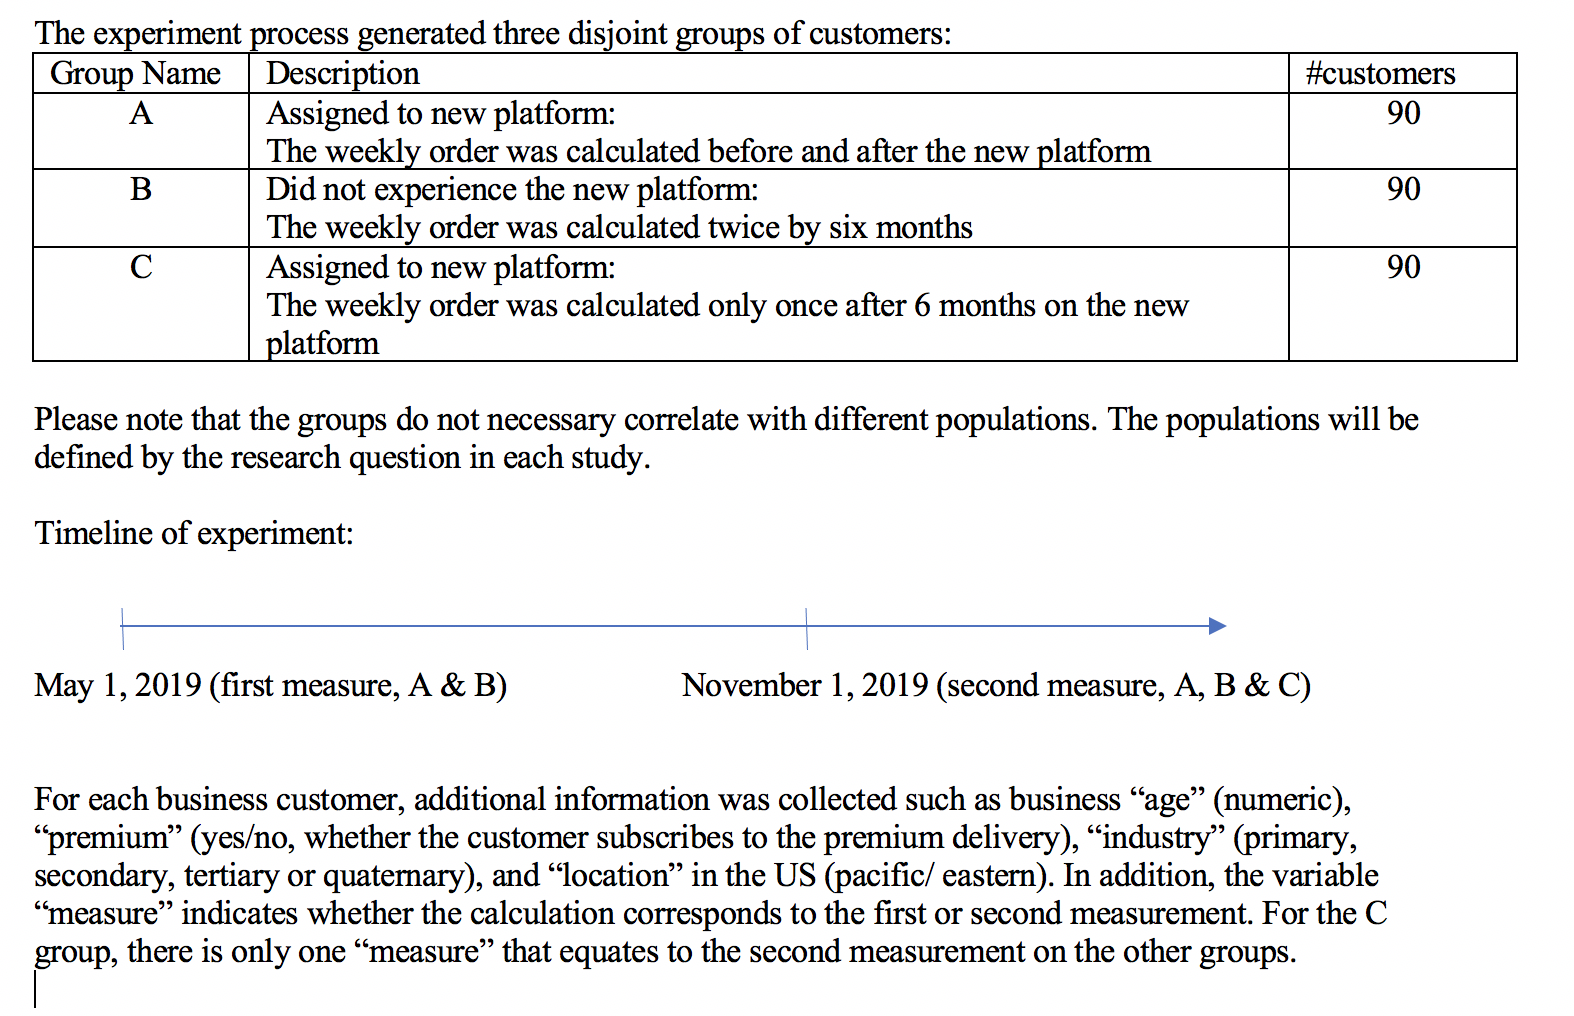
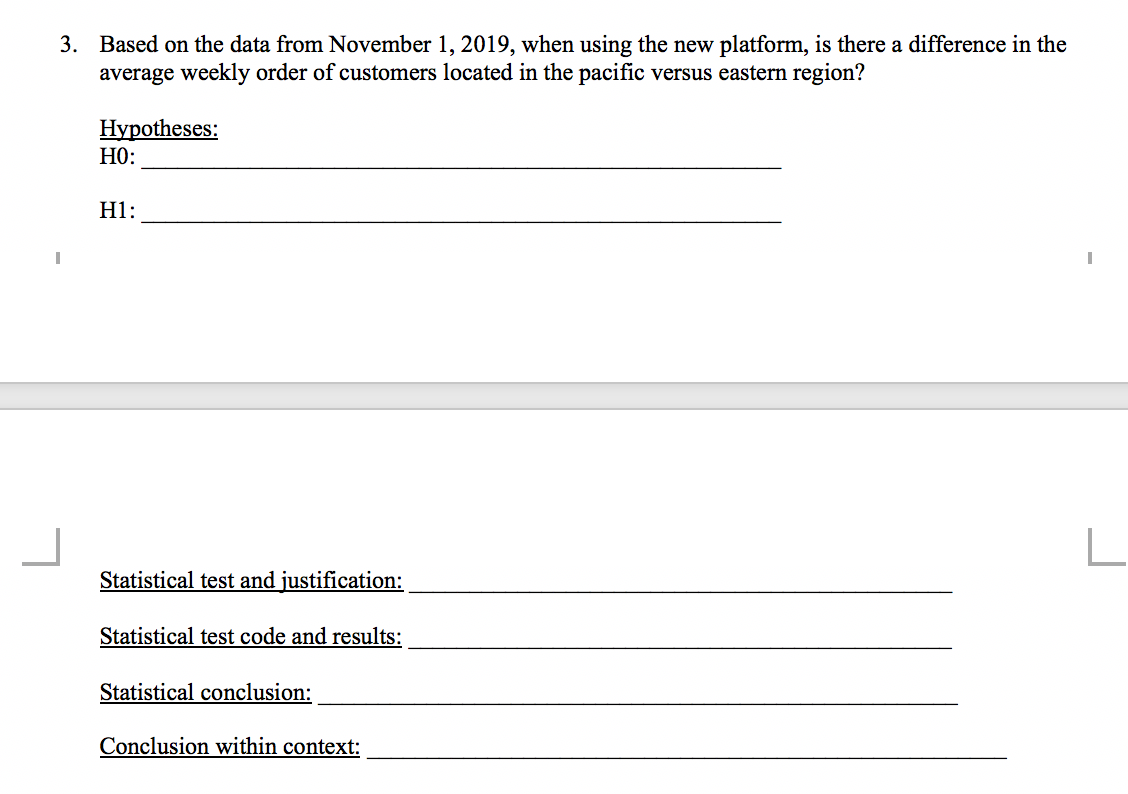
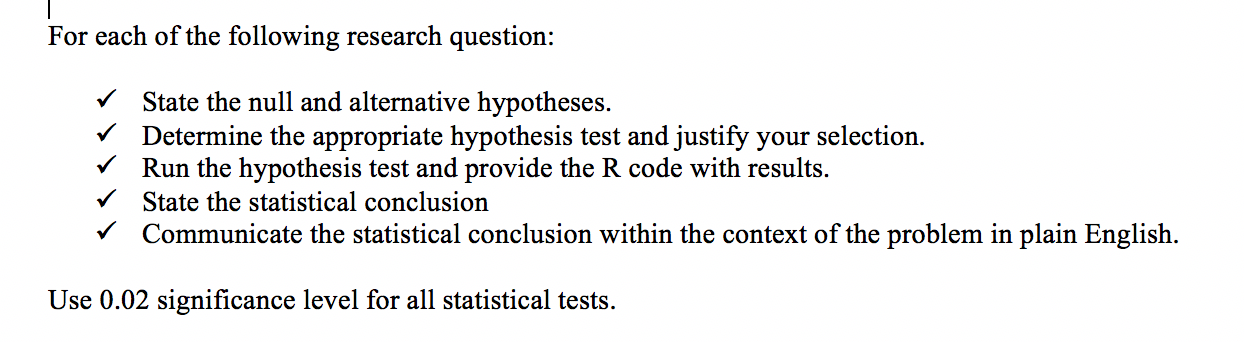
The experiment process generated three disjoint groups of customers: Group Name Description #customers A Assigned to new platform: 90 B The weekly order was calculated before and after the new platform Did not experience the new platform: 90 The weekly order was calculated twice by six months C Assigned to new platform: 90 The weekly order was calculated only once after 6 months on the new platform Please note that the groups do not necessary correlate with different populations. The populations will be defined by the research question in each study. Timeline of experiment: May 1, 2019 (first measure, A & B) November 1, 2019 (second measure, A, B & C) For each business customer, additional information was collected such as business age (numeric), "premium" (yes/no, whether the customer subscribes to the premium delivery), industry" (primary, secondary, tertiary or quaternary), and location in the US (pacific/ eastern). In addition, the variable "measure" indicates whether the calculation corresponds to the first or second measurement. For the C group, there is only one "measure that equates to the second measurement on the other groups. 3. Based on the data from November 1, 2019, when using the new platform, is there a difference in the average weekly order of customers located in the pacific versus eastern region? Hypotheses: HO: H1: Statistical test and justification: Statistical test code and results: Statistical conclusion: Conclusion within context: For each of the following research question: State the null and alternative hypotheses. Determine the appropriate hypothesis test and justify your selection. Run the hypothesis test and provide the R code with results. State the statistical conclusion Communicate the statistical conclusion within the context of the problem in plain English. Use 0.02 significance level for all statistical tests.
Step by Step Solution
There are 3 Steps involved in it

Get step-by-step solutions from verified subject matter experts