

Question: The experimental data in the table below define y as a function of x. a.) Let P be the point (1,1). Complete the table below
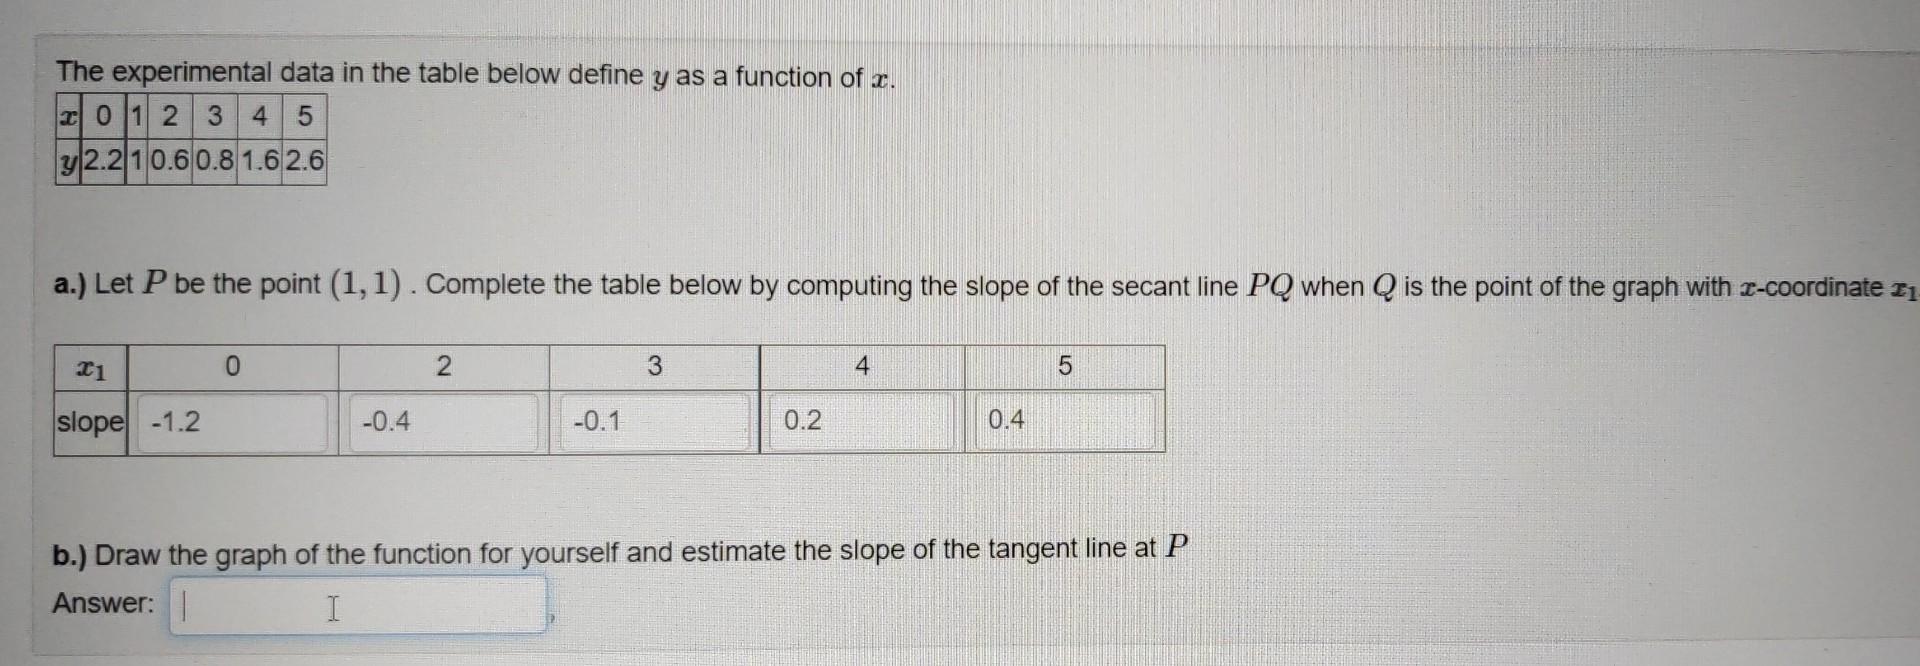
The experimental data in the table below define y as a function of x. a.) Let P be the point (1,1). Complete the table below by computing the slope of the secant line PQ when Q is the point of the graph x-coordinate x. b.) Draw the graph of the function for yourself and estimate the slope of the tangent line at P
Step by Step Solution
There are 3 Steps involved in it
1 Expert Approved Answer
Step: 1 Unlock

Question Has Been Solved by an Expert!
Get step-by-step solutions from verified subject matter experts
Step: 2 Unlock
Step: 3 Unlock