

1) The figure above represents the market for vaccinations. Vaccinations are considered a benefit to society, and...
Fantastic news! We've Found the answer you've been seeking!
Question:
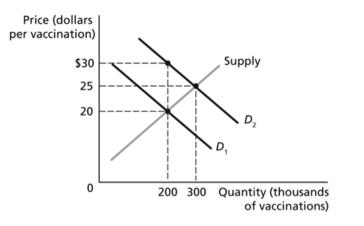
1) The figure above represents the market for vaccinations. Vaccinations are considered a benefit to society, and the figure shows both the marginal private benefit and the marginal social benefit from vaccinations.
a) Which curve represents marginal private benefit?
b) Which curve represents marginal social benefit?
c) What is the market equilibrium price?
d) What is the market equilibrium quantity of vaccinations?
e) What is the efficient equilibrium price?
f) What is the efficient equilibrium quantity of vaccinations?
g) Would economic efficiency be improved in this scenario if more people were vaccinated?
Expert Answer:

Related Book For 

Posted Date:
