

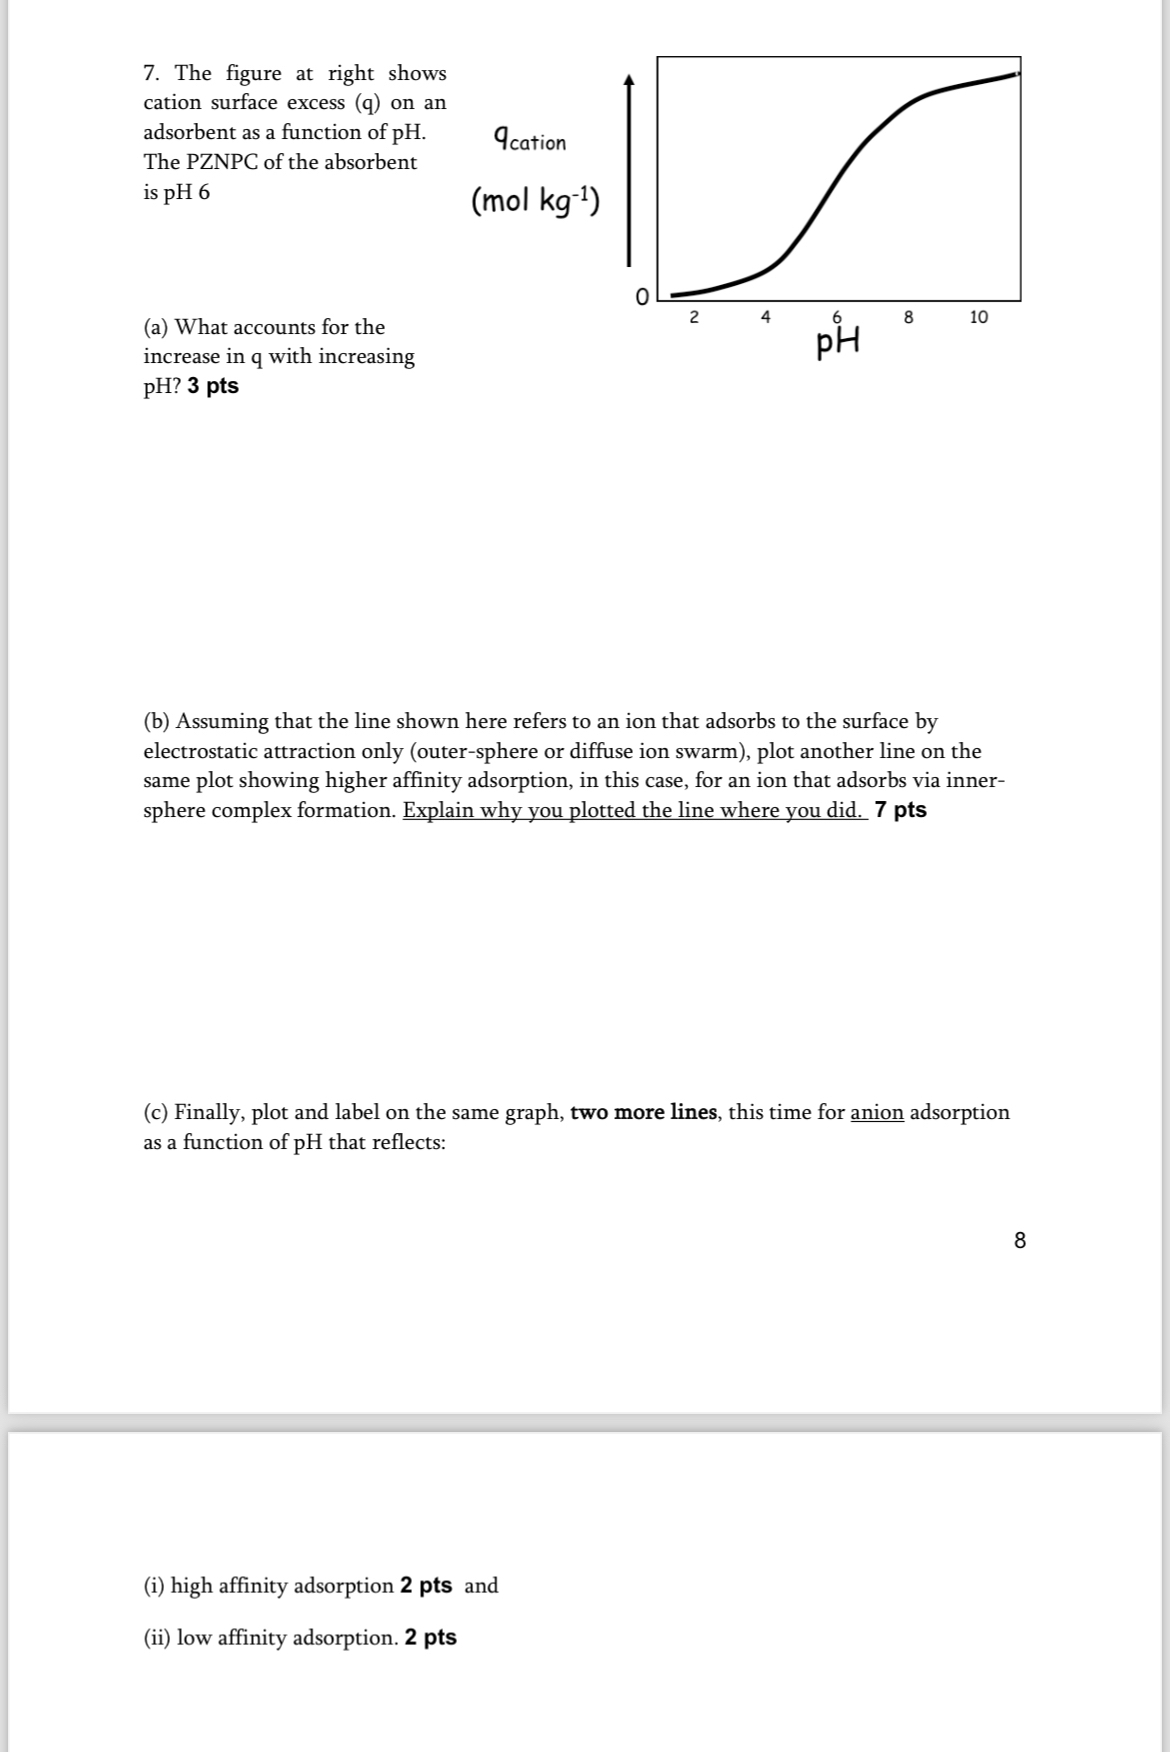
Question: The figure at right shows cation surface excess ( q ) on an adsorbent as a function of p H . The PZNPC of the
The figure at right shows cation surface excess q on an adsorbent as a function of The PZNPC of the absorbent is
a What accounts for the increase in with increasing pts
b Assuming that the line shown here refers to an ion that adsorbs to the surface by electrostatic attraction only outersphere or diffuse ion swarm plot another line on the same plot showing higher affinity adsorption, in this case, for an ion that adsorbs via innersphere complex formation. Explain why you plotted the line where you did. pts
c Finally, plot and label on the same graph, two more lines, this time for anion adsorption as a function of that reflects:
i high affinity adsorption pts and
ii low affinity adsorption. pts
Step by Step Solution
There are 3 Steps involved in it
1 Expert Approved Answer
Step: 1 Unlock

Question Has Been Solved by an Expert!
Get step-by-step solutions from verified subject matter experts
Step: 2 Unlock
Step: 3 Unlock