

Question: The figure below includes the data about Pages Per Minute and Price of 1000 inkjet printers based on the sample of size n = 500
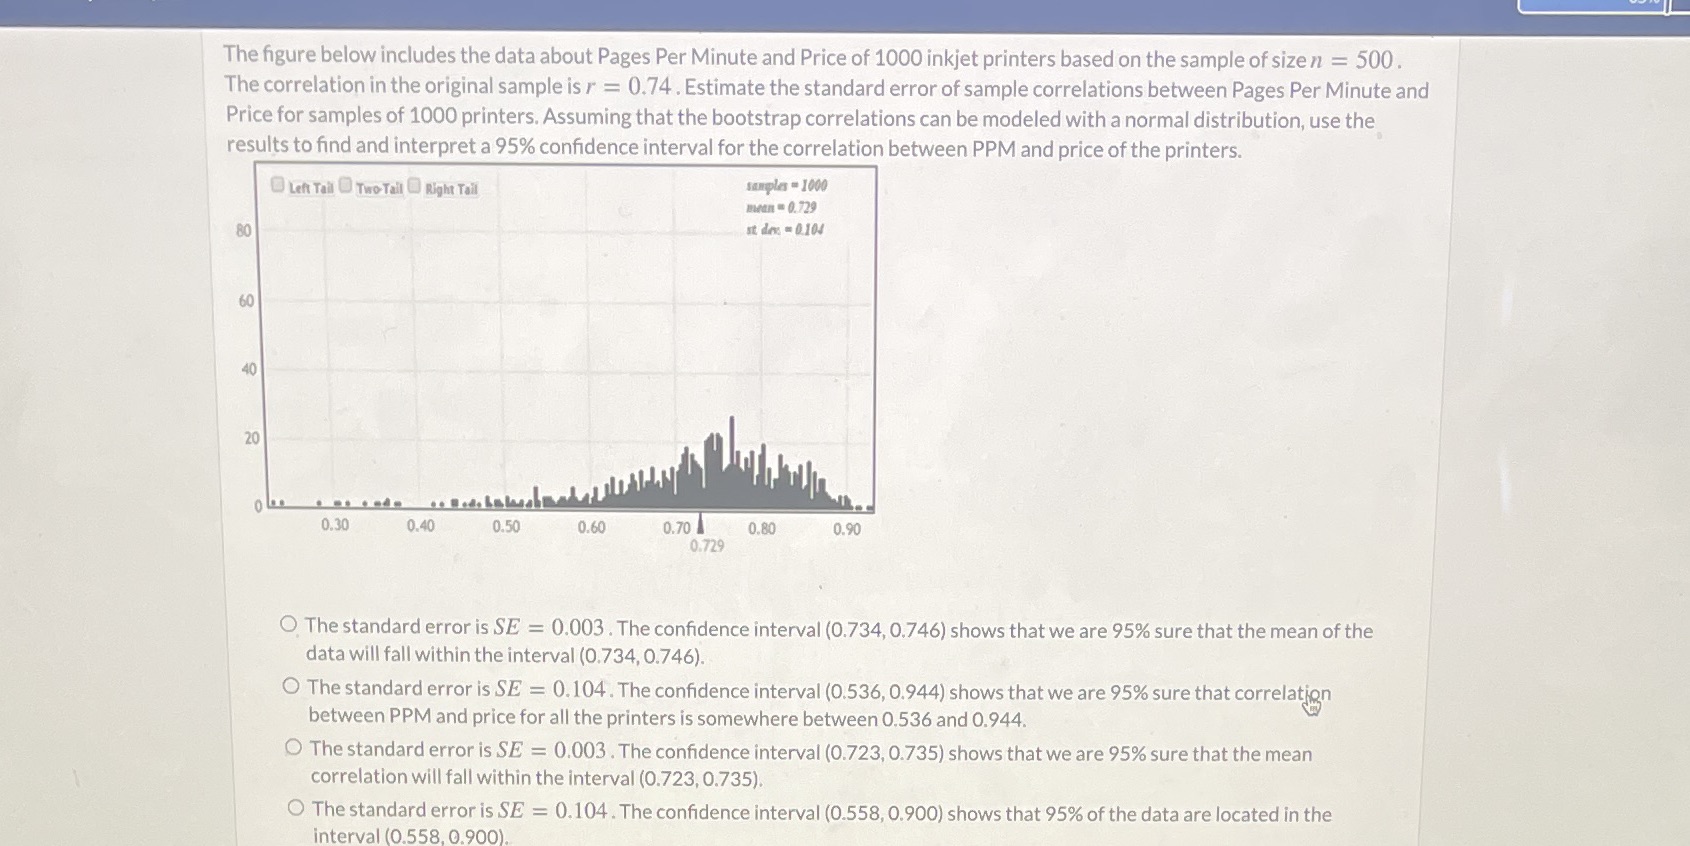
The figure below includes the data about Pages Per Minute and Price of 1000 inkjet printers based on the sample of size n = 500 The correlation in the original sample is r = 0.74. Estimate the standard error of sample correlations between Pages Per Minute and Price for samples of 1000 printers. Assuming that the bootstrap correlations can be modeled with a normal distribution, use the results to find and interpret a 95% confidence interval for the correlation between PPM and price of the printers. Left Tail Two- Tail Right Tail samples = 1000 mean = 0.729 80 st dex = 0.104 60 40 20 0.30 0.40 0.50 0.60 0.70 0.80 0.90 0.729 O The standard error is SE = 0.003 . The confidence interval (0.734, 0.746) shows that we are 95% sure that the mean of the data will fall within the interval (0.734, 0.746). O The standard error is SE = 0.104. The confidence interval (0.536, 0.944) shows that we are 95% sure that correlation between PPM and price for all the printers is somewhere between 0.536 and 0.944. O The standard error is SE = 0.003 . The confidence interval (0.723, 0.735) shows that we are 95% sure that the mean correlation will fall within the interval (0.723, 0.735). The standard error is SE = 0.104. The confidence interval (0.558, 0.900) shows that 95% of the data are located in the interval (0.558, 0.900)
Step by Step Solution
There are 3 Steps involved in it

Get step-by-step solutions from verified subject matter experts