

Question: The figure below is a causal loop diagram describing a simplified version of the People Express airline business case. This model captures the relationships between
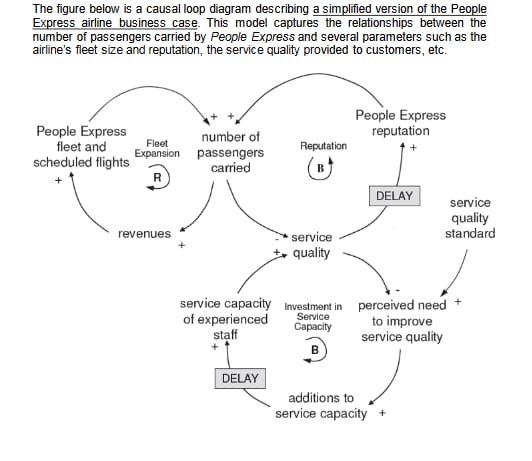
The figure below is a causal loop diagram describing a simplified version of the People Express airline business case. This model captures the relationships between the number of passengers carried by People Express and several parameters such as the airline's fleet size and reputation, the service quality provided to customers, etc. People Express People Express number of reputation fleet and Fleet Reputation Expansion passengers + scheduled flights carried + R DELAY service quality revenues service standard + + quality service capacity Investment in perceived need + of experienced Service Capacity to improve staff service quality B DELAY additions to service capacity +
Step by Step Solution
There are 3 Steps involved in it

Get step-by-step solutions from verified subject matter experts