

Question: The figure below represents the Cu-Ni phase diagram: (20 points) TEMPERATURE CELSIUS 1300- 1250 1200 1150+ A 8.30 Liquids Solidus 0.35 0.48 0.45 0.50
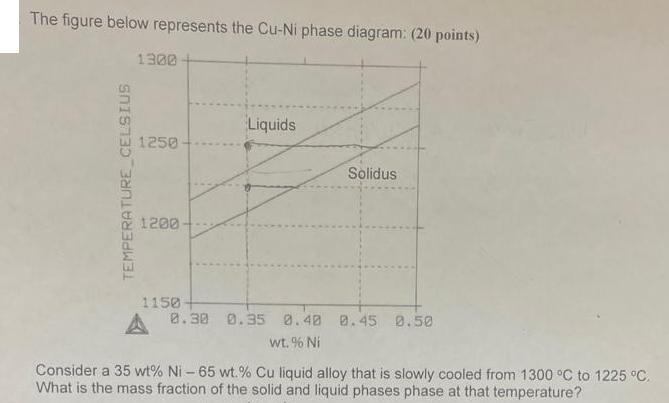
The figure below represents the Cu-Ni phase diagram: (20 points) TEMPERATURE CELSIUS 1300- 1250 1200 1150+ A 8.30 Liquids Solidus 0.35 0.48 0.45 0.50 wt. % Ni Consider a 35 wt% Ni -65 wt.% Cu liquid alloy that is slowly cooled from 1300 C to 1225 C. What is the mass fraction of the solid and liquid phases phase at that temperature?
Step by Step Solution
There are 3 Steps involved in it
1 Expert Approved Answer
Step: 1 Unlock

The image shows a portion of the CuNi binary phase diagram which is used to determine the phases pre... View full answer
Question Has Been Solved by an Expert!
Get step-by-step solutions from verified subject matter experts
Step: 2 Unlock
Step: 3 Unlock