

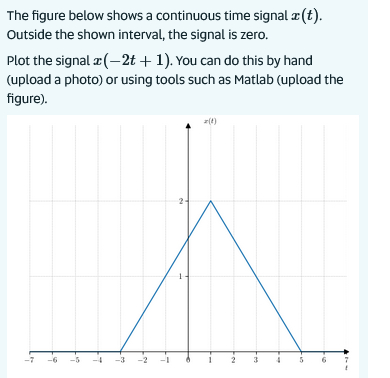
Question: The figure below shows a continuous time signal ( x ( t ) ) . Outside the shown interval, the signal is zero.
The figure below shows a continuous time signal xt Outside the shown interval, the signal is zero.
Plot the signal x t You can do this by hand upload a photo or using tools such as Matlab upload the figure
Step by Step Solution
There are 3 Steps involved in it
1 Expert Approved Answer
Step: 1 Unlock

Question Has Been Solved by an Expert!
Get step-by-step solutions from verified subject matter experts
Step: 2 Unlock
Step: 3 Unlock