

Question: The figure below shows five data points x1, ..., 5 on RP. The numbers on the edges indicate the distance between nodes. C 22 25
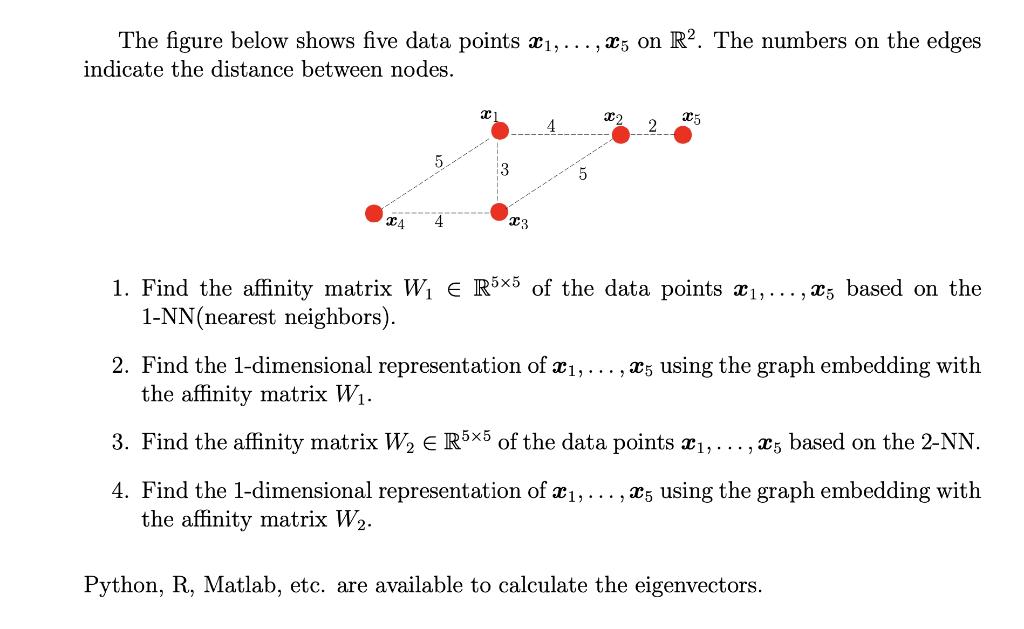
The figure below shows five data points x1, ..., 5 on RP. The numbers on the edges indicate the distance between nodes. C 22 25 3 5 24 4 23 1. Find the affinity matrix W1 R5x5 of the data points #1, ... , x5 based on the 1-NN(nearest neighbors). 2. Find the 1-dimensional representation of x1, the affinity matrix W1. ., 25 using the graph embedding with 3. Find the affinity matrix W2 E R5x5 of the data points 21, ... , X5 based on the 2-NN. 4. Find the 1-dimensional representation of 21, ...,25 using the graph embedding with the affinity matrix W2. Python, R, Matlab, etc. are available to calculate the eigenvectors. The figure below shows five data points x1, ..., 5 on RP. The numbers on the edges indicate the distance between nodes. C 22 25 3 5 24 4 23 1. Find the affinity matrix W1 R5x5 of the data points #1, ... , x5 based on the 1-NN(nearest neighbors). 2. Find the 1-dimensional representation of x1, the affinity matrix W1. ., 25 using the graph embedding with 3. Find the affinity matrix W2 E R5x5 of the data points 21, ... , X5 based on the 2-NN. 4. Find the 1-dimensional representation of 21, ...,25 using the graph embedding with the affinity matrix W2. Python, R, Matlab, etc. are available to calculate the eigenvectors
Step by Step Solution
There are 3 Steps involved in it

Get step-by-step solutions from verified subject matter experts