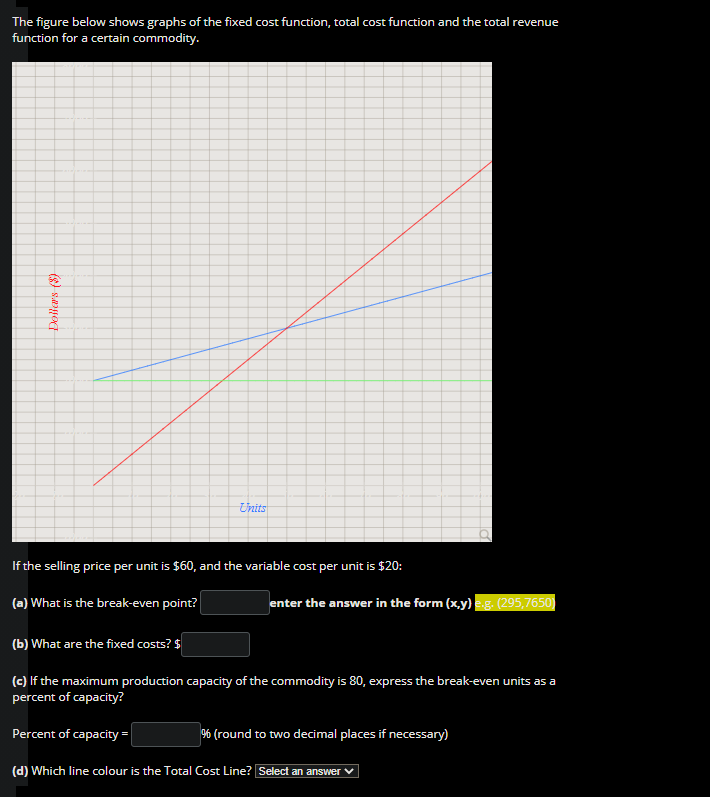
Question: The figure below shows graphs of the fixed cost function, total cost function and the total revenue function for a certain commodity. Dollars (5) Units

The figure below shows graphs of the fixed cost

The figure below shows graphs of the fixed cost function, total cost function and the total revenue function for a certain commodity. Dollars (5) Units If the selling price per unit is $60, and the variable cost per unit is $20: (a) What is the break-even point? enter the answer in the form (x,y) &g (295,7650 (b) What are the fixed costs? $ (c) If the maximum production capacity of the commodity is 80, express the break-even units as a percent of capacity? Percent of capacity= % (round to two decimal places if necessary) (d) Which line colour is the Total Cost Line? Select an answer The figure below shows graphs of the fixed cost function, total cost function and the total revenue function for a certain commodity. Dollars (5) Units If the selling price per unit is $60, and the variable cost per unit is $20: (a) What is the break-even point? enter the answer in the form (x,y) &g (295,7650 (b) What are the fixed costs? $ (c) If the maximum production capacity of the commodity is 80, express the break-even units as a percent of capacity? Percent of capacity= % (round to two decimal places if necessary) (d) Which line colour is the Total Cost Line? Select an

Step by Step Solution

There are 3 Steps involved in it

1 Expert Approved Answer
Step: 1 Unlock blur-text-image
Question Has Been Solved by an Expert!

Get step-by-step solutions from verified subject matter experts

Step: 2 Unlock
Step: 3 Unlock

Students Have Also Explored These Related General Management Questions!