

Question: The figure below shows graphs of the fixed cost function, total cost function and the total revenue function for a certain commodity. 8000 + &
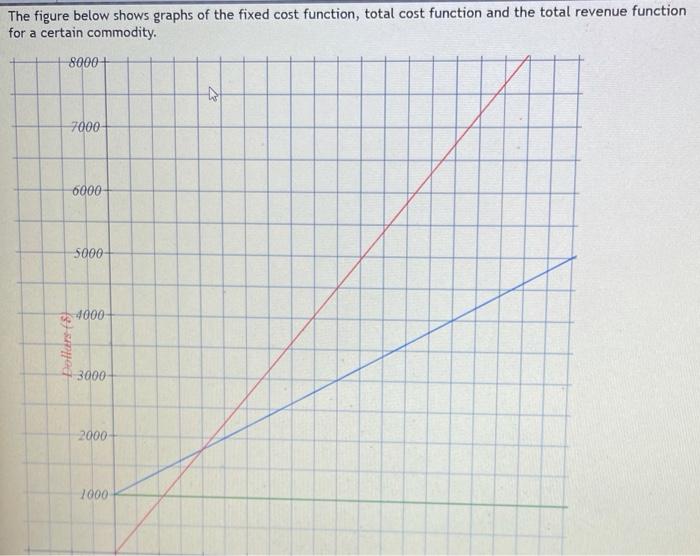
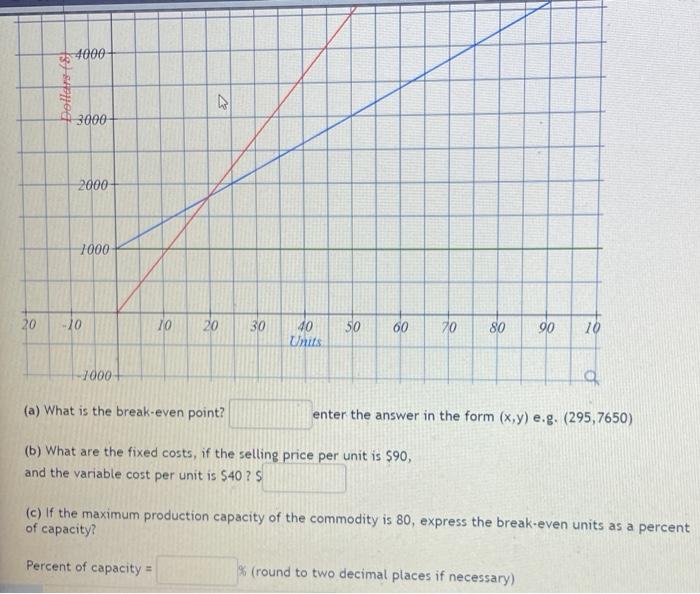
The figure below shows graphs of the fixed cost function, total cost function and the total revenue function for a certain commodity. 8000 + & 7000 6000 5000 -4000 Doller 8 3000 2000 1000 4000 Polters t8 3000 2000 7000 20 -10 10 20 30 50 60 70 80 40 Unuts 90 16 1000+ a (a) What is the break-even point? enter the answer in the form (x,y) e.g. (295,7650) (b) What are the fixed costs, if the selling price per unit is $90, and the variable cost per unit is $40 ? $ (c) If the maximum production capacity of the commodity is 80, express the break-even units as a percent of capacity? Percent of capacity = % (round to two decimal places if necessary)
Step by Step Solution
There are 3 Steps involved in it

Get step-by-step solutions from verified subject matter experts