

Question: The figure below shows student enrollment counts for a small school district for 1 year. Study this graph and answer the following questions.Between which of
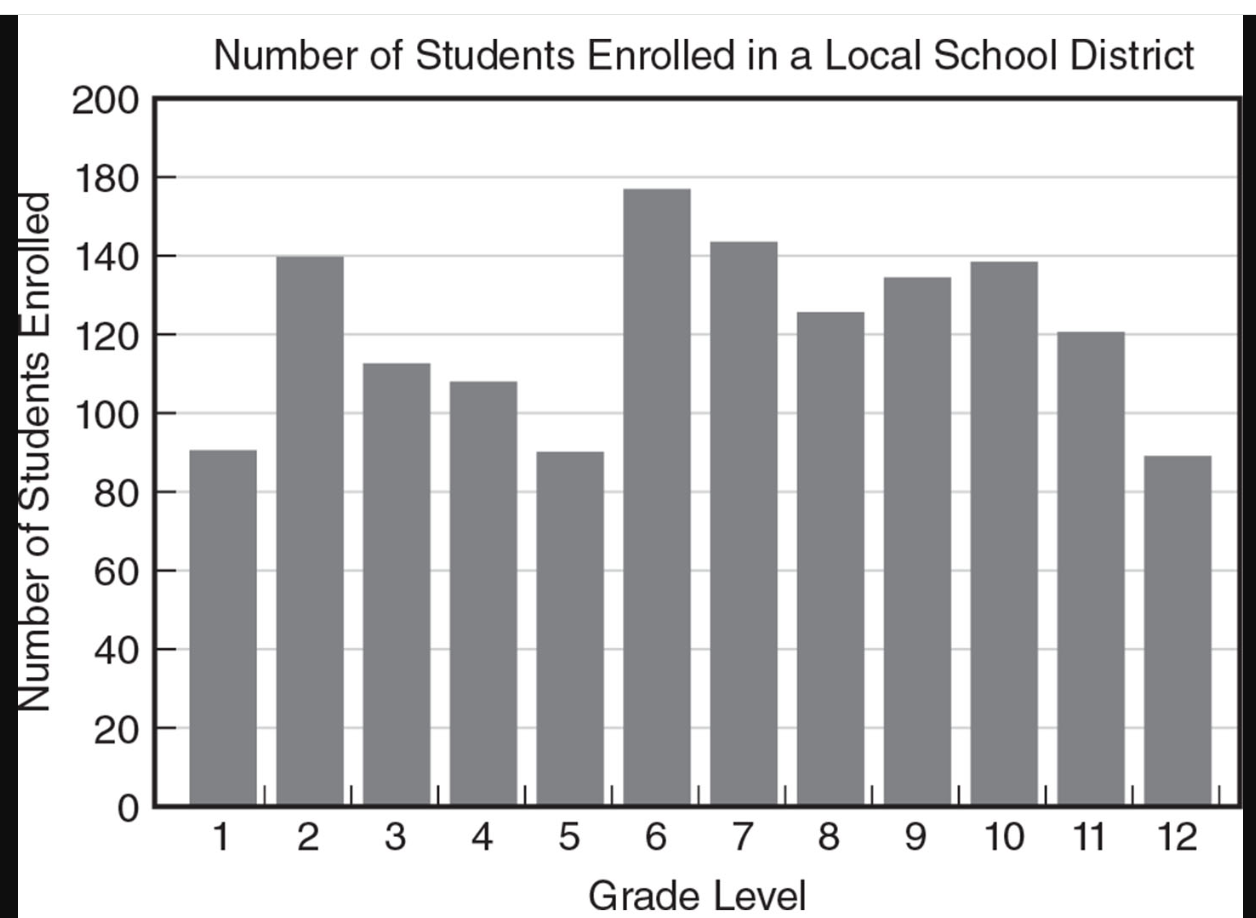
The figure below shows student enrollment counts for a small school district for 1 year. Study this graph and answer the following questions.Between which of the following pairs of grades is there a decrease in the number of students enrolled?Group of answer choices:1, 55, 102, 55, 6
Step by Step Solution
There are 3 Steps involved in it
1 Expert Approved Answer
Step: 1 Unlock

Question Has Been Solved by an Expert!
Get step-by-step solutions from verified subject matter experts
Step: 2 Unlock
Step: 3 Unlock