

Question: The figure below shows the angular velocity for a system graphed as a function of time. Assume that all the horizontal divisions are in
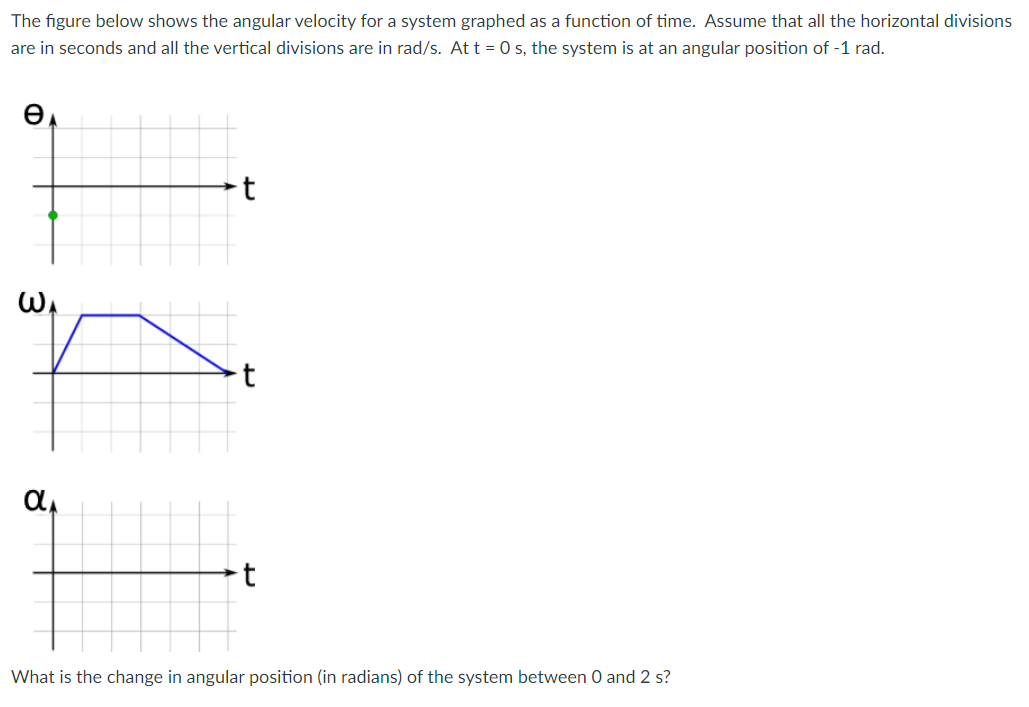
The figure below shows the angular velocity for a system graphed as a function of time. Assume that all the horizontal divisions are in seconds and all the vertical divisions are in rad/s. At t = 0 s, the system is at an angular position of -1 rad. e W 8 LA t t t What is the change in angular position (in radians) of the system between 0 and 2 s?
Step by Step Solution
★★★★★
3.46 Rating (156 Votes )
There are 3 Steps involved in it
1 Expert Approved Answer
Step: 1 Unlock

To find the change in angular position between 0 and 2 seconds we n... View full answer
Question Has Been Solved by an Expert!
Get step-by-step solutions from verified subject matter experts
Step: 2 Unlock
Step: 3 Unlock