

The figure below shows the distribution of temperature. in degrees C. in a 5 meter by 5
Fantastic news! We've Found the answer you've been seeking!
Question:
The figure below shows the distribution of temperature. in degrees C. in a 5 meter by 5 meter heated room.
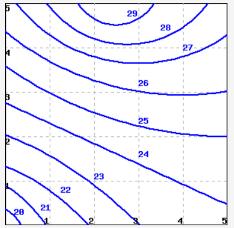
Using Riemann sums. estimate the average temperature in the room. To be more precise: calculate an upper estimate by using the largest sample value in each square, and a lower estimate by using the smallest sample value in each square. Use whole numbers for the sample values. For example, in the lower left corner, the minimum sample temperature is 19. and the maximum sample temperature is 22 . The answer should be the average of the upper and lower estimates. average temperature.
Expert Answer:

Related Book For 

Posted Date:
