

Question: The figure below shows the expected yearly return v.s. the beta of various portfolios in a market in which the assumptions of CAPM hold. We
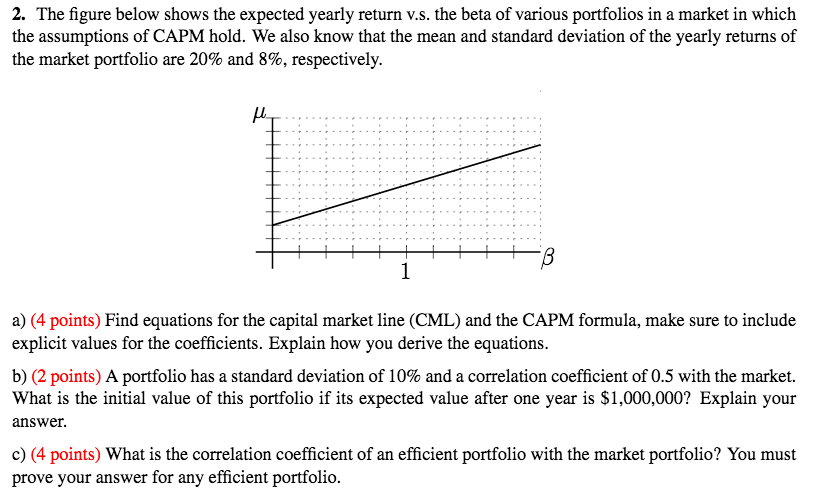
The figure below shows the expected yearly return v.s. the beta of various portfolios in a market in which the assumptions of CAPM hold. We also know that the mean and standard deviation of the yearly returns of the market portfolio are 20% and 8%, respectively. Find equations for the capital market line (CML) and the CAPM formula, make sure to include explicit values for the coefficients. Explain how you derive the equations. A portfolio has a standard deviation of 10% and a correlation coefficient of 0.5 with the market. What is the initial value of this portfolio if its expected value after one year is $1,000,000? Explain your answer What is the correlation coefficient of an efficient portfolio with the market portfolio? You must prove your answer for any efficient portfolio
Step by Step Solution
There are 3 Steps involved in it

Get step-by-step solutions from verified subject matter experts